

Your catering business just wrapped up what felt like a successful wedding. The client raved about the food, your team executed flawlessly, and the check cleared. Three weeks later, you're staring at your monthly P&L wondering where all the profit went.
That wedding lost money. Not because anything went wrong — but because you measured success by how the event felt instead of how it performed operationally. Without tracking the right metrics per event, profitable catering businesses slowly bleed cash through invisible inefficiencies that compound across dozens of events each month.
Most caterers track overall monthly revenue and food costs. Maybe labor hours. But two events with identical revenue can have wildly different profit margins based on factors you're not measuring. One corporate lunch might generate 35% margins while a similar-sized wedding barely breaks even — and without per-event KPI tracking, you'd never know which types of events actually drive your business forward.
The Hidden Math Behind Event Profitability
Every catering operation has a profit formula whether they realize it or not. The businesses that scale successfully understand theirs down to the decimal point. The ones that struggle keep guessing based on gut feel and bank balance.
Take two real scenarios from catering operations:
Event A: 100-person corporate lunch, $3,500 revenue Event B: 100-person wedding reception, $8,500 revenue
Most caterers would push for more weddings based on that revenue difference. But when you actually measure the operational KPIs, the story flips completely.
The corporate lunch required 4 staff for 6 hours, standard menu items you prep in bulk, minimal rentals, and predictable execution. Your actual profit: $1,400.
The wedding needed 8 staff for 12 hours, custom menu modifications, extensive rentals coordination, multiple venue visits, and three menu tastings before booking. Your actual profit: $850.
Without tracking labor utilization, prep efficiency, and hidden coordination costs per event, you'd keep chasing high-revenue weddings while your most profitable revenue stream — those "boring" corporate lunches — gets ignored.
Building Your Catering KPIs Framework
Analyzing hundreds of catering operations shows certain metrics consistently predict which businesses scale profitably versus those that hit growth ceilings. These aren't the vanity metrics that look good on paper. They're operational indicators that actually drive decision-making.
End chaos with centralized catering management.
Caterngly helps you plan, confirm, and manage every catering event seamlessly.
- Unified event and order management
- Real-time client updates
- Staff and resource scheduling
No credit card required
1. Cost Per Cover (Beyond Basic Food Cost)
Calculation: (Food Cost + Labor Cost + Rental Cost + Delivery Cost + Overhead Allocation) ÷ Guest Count
-
POS system for food costs
-
Timesheets for labor hours
-
Rental invoices
-
Delivery logs
-
Fixed cost allocation (usually 12-15% of revenue)
A 50-person corporate event might show:
-
Food
$15 per person
-
Labor
$8 per person
-
Rentals
$3 per person
-
Delivery
$2 per person
-
Overhead
$4 per person
-
Total
$32 per cover
With $50 per person pricing, that's $18 profit per cover or 36% margin. But change any variable — add a second delivery location, require specialty rentals, need an extra server — and margins evaporate quickly.
Track cost per cover by venue to spot location-based hidden costs.
2. Labor Utilization Rate
Calculation: (Billable Event Hours ÷ Total Hours Paid) × 100
Target: 70-75% for healthy operations
This metric exposes expensive truth. If your team works 40 hours but only 25 hours are billable to events, you're burning cash on prep, cleanup, travel, and coordination that might be inefficient.
One catering operation discovered their utilization rate was 45%. They were paying full-time staff who spent most of their time on unbillable prep work that could have been batched or systematized. By restructuring their prep schedule and creating standard mise en place systems, they pushed utilization to 65% and saved roughly $3,400 monthly in labor costs.
3. On-Time Delivery Score
Late catering kills reputations faster than bad food. But "on-time" needs clearer definition than "we got there eventually."
-
Early arrival (setup complete 15+ minutes before service)
100%
-
On-time (setup complete 0-15 minutes before service)
100%
-
Slightly late (setup complete 0-10 minutes after service time)
50%
-
Significantly late (10+ minutes after service time)
0%
Calculation: Average score across all events in period
You'll need delivery logs with actual arrival times, event contracts with promised service times, and staff check-in systems to track this accurately.
4. Waste Percentage Per Event
Calculation: (Weight or Cost of Disposed Food ÷ Total Food Prepared) × 100
Target: Under 5% for plated service, under 8% for buffets
-
Weigh or estimate leftover food after each event
-
Note which items consistently return unused
-
Track separately for different service styles
A catering company tracking waste discovered their buffet events averaged 12% waste while plated dinners stayed under 4%. Deeper analysis showed certain buffet items (looking at you, quinoa salad) consistently returned 40% unused. By adjusting buffet quantities and removing chronically wasted items, they cut food costs by $800 per month without impacting guest satisfaction.
5. Event Acquisition Cost
Calculation: (Marketing Spend + Sales Labor + Tasting Costs + Proposal Time) ÷ Number of Events Booked
Components to track include:
-
Digital advertising spend
-
Sales coordinator salary allocation
-
Food and labor for tastings
-
Time spent on proposals (valued at hourly rate)
Most caterers discover their acquisition cost varies wildly by channel. Wedding expos might cost $500 per booking when you factor in booth fees, samples, and follow-up time. Meanwhile, corporate email outreach might only cost $125 per booking but generate lower-revenue events.
6. Repeat Event Rate
Calculation: (Number of Repeat Clients ÷ Total Clients) × 100
Measurement Period: Usually calculated annually
Deeper insights come from tracking by event type, measuring time between repeat bookings, and noting which events lead to referrals.
One operation found their repeat rate was only 22% overall, but corporate clients repeated at 67% while social events barely hit 8%. They shifted focus to corporate relationship building and saw overall profitability improve despite fewer total events.
7. Kitchen Productivity Score
Calculation: (Number of Covers Produced ÷ Kitchen Labor Hours) × (1 - Waste %) × On-Time %
Example:
-
500 covers produced
-
50 kitchen hours
-
6% waste
-
90% on-time
-
Score
(500 ÷ 50) × 0.94 × 0.90 = 8.46
Track this weekly and you'll spot when kitchen operations start breaking down. A declining score usually appears 2-3 weeks before major service problems surface.
8. Revenue Per Available Service Day
Calculation: Total Revenue ÷ Maximum Possible Service Days
Determining capacity requires counting viable event days (typically Thursday through Sunday), subtracting holidays and planned closures, then factoring in realistic simultaneous event capacity.
If you can handle 8 events per week maximum (2 per day on weekends) and generate $40,000 monthly revenue, your revenue per available day is $1,250. This metric helps evaluate whether you need more volume or better margins.
Creating Your Dashboard Without Complex Software
You don't need expensive analytics platforms to track these KPIs. A properly structured spreadsheet handles 90% of catering operations perfectly well.
Basic Dashboard Structure
Tab 1: Event Log
-
Event date
-
Client name
-
Event type
-
Guest count
-
Revenue
-
Food cost
-
Labor hours
-
Labor cost
-
Rental cost
-
Delivery cost
-
Actual service time
-
Waste amount
-
Repeat client (Y/N)
-
Acquisition channel
Tab 2: Calculated Metrics
-
Cost per cover by event type
-
Labor utilization trends
-
On-time percentages
-
Waste patterns
-
Acquisition costs by channel
-
Monthly/quarterly rollups
Tab 3: Decision Thresholds
-
Cost per cover over 65% of revenue
-
Labor utilization under 60%
-
On-time delivery under 85%
-
Waste over 10%
-
No repeat bookings in 30 days
| Tab | Columns |
|---|---|
| Tab 1: Event Log | Event date; Client name; Event type; Guest count; Revenue; Food cost; Labor hours; Labor cost; Rental cost; Delivery cost; Actual service time; Waste amount; Repeat client (Y/N); Acquisition channel |
| Tab 2: Calculated Metrics | Cost per cover by event type; Labor utilization trends; On-time percentages; Waste patterns; Acquisition costs by channel; Monthly/quarterly rollups |
| Tab 3: Decision Thresholds | Cost per cover over 65% of revenue; Labor utilization under 60%; On-time delivery under 85%; Waste over 10%; No repeat bookings in 30 days |
The key is consistent data entry after every event. Takes maybe 10 minutes per event, but the insights compound quickly.
A simple workflow ties data sources into the spreadsheet and flags decision thresholds.
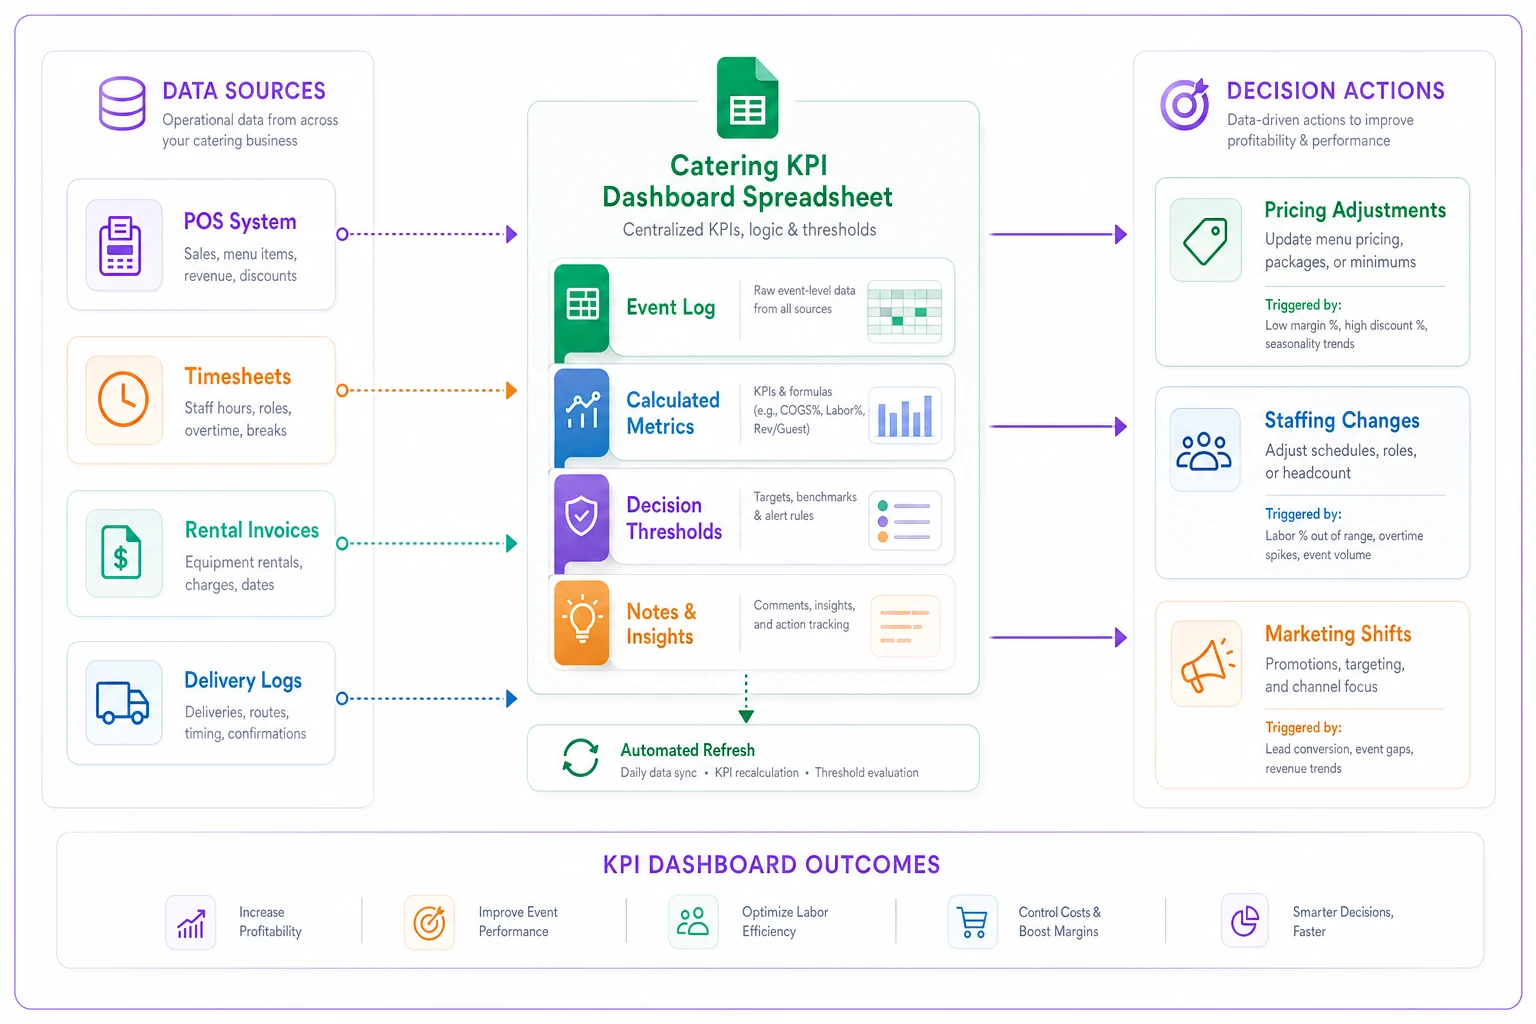
This setup handles most decision-making without complex software.
Decision Thresholds That Actually Drive Action
Tracking KPIs means nothing if you don't act when they signal problems. Successful catering operations use these operational thresholds:
When Cost Per Cover Exceeds 65% of Revenue
Immediate actions worth taking:
-
Review last 10 events for common cost overruns
-
Check if portion sizes have crept up
-
Audit labor scheduling for overstaffing patterns
Systemic changes if the problem persists:
-
Revise menu pricing
-
Eliminate low-margin items
-
Renegotiate supplier contracts
-
Adjust service style offerings
When Labor Utilization Drops Below 60%
Investigation points to check:
-
Are you overstaffed for current volume?
-
Is prep work expanding beyond reasonable time?
-
Are staff spending excessive time on non-billable tasks?
Corrections that work:
-
Batch prep across multiple events
-
Cross-train staff to increase flexibility
-
Adjust scheduling to match demand patterns
-
Consider shifting some roles to part-time
When On-Time Delivery Falls Below 85%
Check these factors first:
-
Distance patterns for late events
-
Specific staff members involved
-
Day of week patterns
-
Types of events affected
Fixes that actually work:
-
Add buffer time for certain event types
-
Create dedicated routes for far locations
-
Implement pre-event day prep requirements
-
Establish delivery zone limits
When Waste Exceeds 10%
Analysis needed includes:
-
Which menu items return unused?
-
Are buffet quantities consistently off?
-
Do certain venues correlate with higher waste?
-
Is waste concentrated in specific courses?
Solutions that reduce waste:
-
Adjust standard quantities down by 10%
-
Remove chronically wasted items
-
Improve storage and transport methods
-
Train service staff on portion control
Tracking KPIs means nothing if you don't act when they signal problems. Successful catering operations use these operational thresholds:
The Compound Effect of Measurement
A catering business started tracking these eight KPIs consistently. Nothing else changed initially — same menu, same team, same marketing. Within three months, they identified that Sunday brunches generated 40% margins while Saturday night galas barely hit 15%.
They didn't stop doing galas entirely. But they raised gala pricing by 20%, reduced brunch pricing by 10% to capture more volume, and shifted their marketing focus. Six months later, revenue increased by 15% but profit jumped by 45%.
Operational metrics don't fix problems directly. They reveal which problems are worth fixing and which opportunities are worth chasing. A catering operation running blind might work harder and harder while margins shrink. One with clear KPI visibility can make three strategic adjustments and transform their entire business model.
When Manual Tracking Hits Its Limit
Spreadsheet tracking works beautifully for operations handling 10-20 events monthly. Beyond that, manual data entry becomes its own operational burden. You spend so much time updating tracking sheets that you stop making decisions from the data.
That inflection point — usually around $60k monthly revenue — is when catering operations benefit from automated tracking systems. Modern operational platforms can pull data from your POS, scheduling system, and event management tools to calculate these KPIs automatically. AI automation handles the pattern recognition that would take hours of spreadsheet analysis, flagging when your cost per cover for corporate events creeps above threshold or when Tuesday deliveries consistently run late.
The transition from manual to automated tracking isn't about the technology though. It's about reaching a scale where the time saved on data entry can be redirected to acting on insights. If you're spending three hours weekly updating spreadsheets but not making operational changes from that data, automation won't help. But if you're consistently using KPI insights to adjust operations and just need more bandwidth to dig deeper, that's when systematic tracking platforms multiply your effectiveness.
Building Your First Dashboard This Week
Start simple. Pick three KPIs from the eight above — probably cost per cover, on-time delivery, and labor utilization. Track just those for your next 10 events.
Create a basic spreadsheet with one row per event. Calculate each metric manually at first. Look for patterns after just five events. By event ten, you'll have enough data to make one operational change with confidence.
The catering operations that thrive don't have perfect systems. They have good-enough systems they actually use. Your competition is probably still guessing at profitability based on bank balance and gut feel. Even basic KPI tracking puts you ahead of 80% of catering operations.
Every event teaches you something about your operation — but only if you're measuring the right things. That wedding that felt successful but lost money? Next time you'll spot the warning signs during the proposal phase. The corporate lunch that seemed boring but generated massive margins? You'll start actively pursuing similar opportunities.
The difference between catering businesses that scale profitably and those that burn out isn't talent or recipes or even marketing. It's knowing your numbers well enough to make decisions before problems compound. A simple dashboard showing eight KPIs changes your operation from reactive to strategic. The only question is whether you'll start tracking before or after your next profit leak becomes a crisis.
Ready to elevate your catering business?
Join 500+ caterers trusting Caterngly to save time, reduce errors, and deliver flawless events.