
Most catering operations price events the same way they did five years ago—basic food cost calculation, some labor overhead, and whatever margin feels reasonable that day. Meanwhile, actual event profitability swings wildly between 8% and 35% depending on factors nobody tracks systematically.
The disconnect between pricing and operations creates a specific, painful problem. You quote a wedding at what seems like healthy margin, but by the time you factor in that venue's loading dock situation, the unexpected dietary accommodations, and overtime from timeline changes, you're barely breaking even. Then next week, a simple corporate lunch you priced conservatively ends up generating twice the margin because everything aligned operationally.
Building a real catering pricing system means connecting your cost structure directly to operational KPIs, then creating triggers that adjust pricing based on what actually happens during events. Not the "food cost times three" formula from culinary school—a living system that evolves with your operation.
The structural problem with how most caterers price
Traditional catering pricing treats every event like it exists in isolation. Calculate food costs, add standard labor rates, tack on overhead, done. This assumes every corporate lunch runs the same operationally, every wedding creates identical complexity, and seasonal variations don't fundamentally change your cost structure.
They do, though. A summer wedding might require 40% more prep labor because your kitchen runs hotter and slower. Corporate events in December often demand rush charges from vendors who are already slammed. Downtown venues with loading dock restrictions can add two hours of labor that suburban locations never require.
Pricing mistakes compound when you don't track any of this systematically. Most caterers discover margin problems months after the damage, usually when reviewing quarterly financials. By then, you've locked in contracts at unprofitable rates, trained clients to expect certain pricing, and built operational patterns around flawed economics.
What breaks this cycle is treating pricing as an operational system rather than a sales exercise—building structured cost cards, defining margin thresholds by event type, and creating triggers that flag when pricing needs to move.
Building modular cost cards that capture true operational costs
Cost cards transform pricing from guesswork into systematic calculation. Instead of rough food cost percentages, you build detailed templates that capture every operational variable affecting profitability.
End chaos with centralized catering management.
Caterngly helps you plan, confirm, and manage every catering event seamlessly.
- Unified event and order management
- Real-time client updates
- Staff and resource scheduling
No credit card required
Start with base cost categories that go beyond simple ingredients:
Food and beverage costs:
-
Raw ingredients at current vendor pricing
-
Prep labor specific to menu complexity
-
Waste factor based on portion style (buffet vs plated)
-
Storage costs for advance prep
-
Packaging for transport
Direct labor costs:
-
Kitchen prep hours by menu type
-
Service staff requirements by guest count and service style
-
Setup and breakdown labor by venue type
-
Transportation time between kitchen and venue
-
Administrative time for event coordination
Variable operational costs:
-
Vehicle and fuel costs scaled by distance
-
Equipment rental or depreciation
-
Venue-specific requirements (stairs, elevators, load-in restrictions)
-
Insurance adjustments for event type
-
Permit and licensing fees by municipality
Build separate cost card templates for each major event category. A corporate breakfast requires fundamentally different operational resources than a wedding reception, even at similar guest counts.
A 75-person corporate breakfast cost card might look like this:
-
Food costs
$8.50 per person
-
Prep labor
3 hours at $22/hour = $0.88 per person
-
Service labor
2 staff for 3 hours at $18/hour = $1.44 per person
-
Setup/breakdown
2 hours at $18/hour = $0.48 per person
-
Transportation
$45 flat + $0.60 per person
-
Operations overhead
12% of direct costs
Total operational cost: $12.86 per person before margin
Compare that to a 75-person wedding dinner with similar headcount but completely different operational demands:
-
Food costs
$24 per person
-
Prep labor
8 hours at $22/hour = $2.35 per person
-
Service labor
6 staff for 6 hours at $18/hour = $8.64 per person
-
Setup/breakdown
4 hours at $18/hour = $0.96 per person
-
Transportation
$85 flat + $1.13 per person
-
Equipment rental
$3.20 per person
-
Operations overhead
15% of direct costs
Total operational cost: $42.78 per person before margin
The difference isn't food quality—it's the entire operational footprint. Your cost cards need to reflect that reality.
Link vendor price feeds to your cost card templates so ingredient changes update every template automatically.
Build cost cards once, maintain them, and let them drive quotes rather than the other way around.
Mapping KPI thresholds to event-type margin bands
Once you have detailed cost cards, the next layer is setting margin thresholds that trigger pricing actions. Different event types naturally support different margin profiles based on operational complexity and market dynamics.
Create margin bands for each event category:
| Event Type | Margin Bands and Notes |
|---|---|
| Corporate catering margins (typically 28-38%): | - Below 28%: Requires immediate review - 28-32%: Minimum acceptable range - 32-35%: Target operational range - 35-38%: Premium positioning possible - Above 38%: Market may not sustain, verify calculations |
| Social events margins (typically 22-32%): | - Below 22%: Unprofitable, reject or reprice - 22-26%: Acceptable for strategic bookings only - 26-30%: Standard operational target - 30-32%: Achievable with operational excellence - Above 32%: Rare, usually indicates missed costs |
| Non-profit/institutional margins (typically 15-25%): | - Below 15%: Operating at loss - 15-18%: Minimum viable with volume - 18-22%: Sustainable with efficiency - 22-25%: Strong performance for category - Above 25%: Unusual, verify all costs included |
These aren't arbitrary ranges. They reflect operational realities across event types. Corporate clients book further out, pay promptly, and rarely make last-minute changes. Social events create more operational chaos but clients accept higher pricing. Institutional contracts provide volume but squeeze margins through competitive bidding.
Your KPIs dashboard needs to track actual margins against these thresholds in real-time, not just quarterly. When margins drift outside acceptable bands, your pricing system needs a defined response.
Creating pricing triggers and escalation rules
Static pricing fails because costs change faster than manual reviews catch them. You need triggers that flag when adjustments are necessary before margins erode past recovery.
Ingredient cost triggers:
-
When key ingredients increase more than 8% over a rolling 30-day window
-
Flag all quotes using those ingredients
-
Generate revised cost cards with updated pricing
-
Alert the sales team to pause quoting until reviewed
-
Prepare client communication templates about increases
Labor cost triggers:
-
When overtime exceeds 15% of total labor for an event type
-
Review the staffing model for that category
-
Adjust baseline labor calculations in cost cards
-
Implement a temporary surcharge for peak periods
-
Evaluate whether minimum guest counts need to move
Operational complexity triggers:
-
When specific venues consistently create 20% more labor
-
Add a venue-specific surcharge to quotes
-
Document the operational challenges for the sales team
-
Consider whether the venue remains worth servicing
-
Negotiate operational accommodations directly with the venue
Seasonal demand triggers:
-
When booking rates exceed 85% capacity for specific date ranges
-
Implement surge pricing (10-20% increase)
-
Pull back discounting authority from the sales team
-
Prioritize higher-margin event types
-
Adjust minimum revenue thresholds
The escalation path matters as much as the triggers themselves. Not every trigger demands an immediate price increase. Sometimes operational adjustments restore margins without touching client pricing at all.
-
First attempt
Consolidate Tuesday routes to cut transportation costs
-
Second attempt
Shift Tuesday menus toward higher-margin items
-
Third attempt
Implement Tuesday minimum order quantities
-
Final escalation
Add a Tuesday delivery surcharge or eliminate the service
This graduated response protects client relationships while defending margins.
Here's a simple workflow visualization.
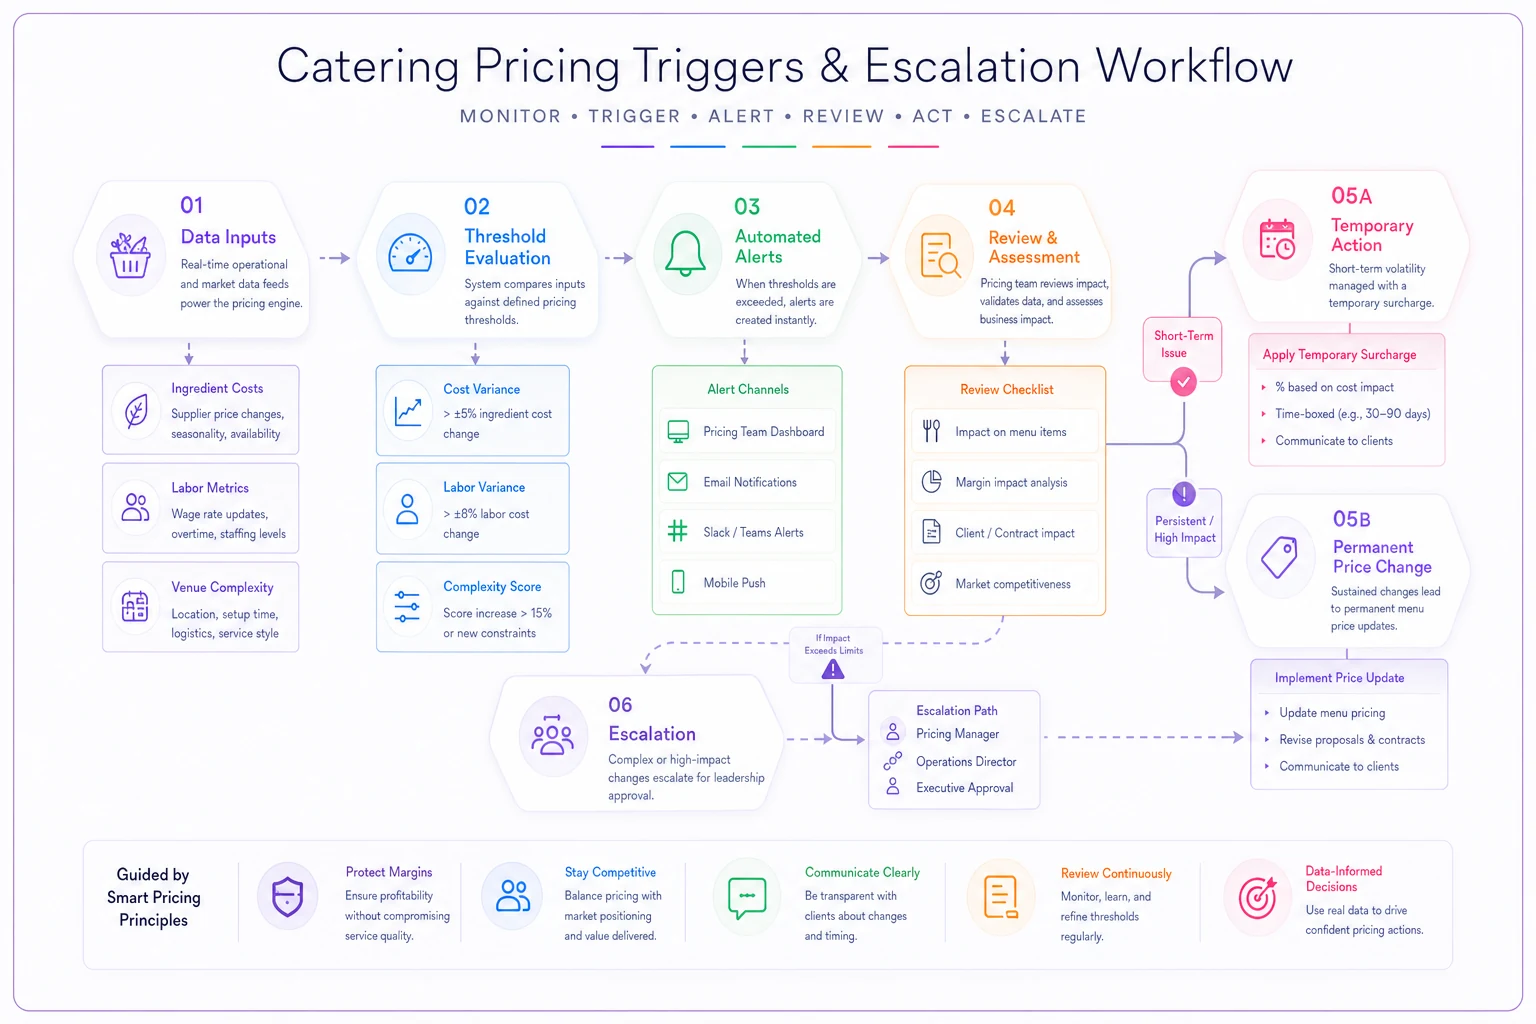
Use the workflow to decide whether to act operationally first or adjust pricing immediately.
Temporary surcharges vs permanent price adjustments
When to implement a temporary surcharge versus a permanent increase is one of the more consequential decisions in catering pricing. Get it wrong and you either destroy client relationships or absorb losses you didn't need to.
Temporary surcharges work for:
-
Seasonal cost spikes (holiday labor premiums)
-
Short-term vendor price volatility
-
Specific venue or date challenges
-
Market-wide disruptions like fuel surges
-
Peak demand periods
Structure temporary surcharges as separate line items with clear expiration dates. "December holiday service charge: 15% (December 15-31)" lands differently than quietly embedding the increase in base pricing. Clients understand temporary market conditions. They resist permanent increases without explanation.
Permanent price adjustments become necessary when:
-
Base costs shift structurally (minimum wage increases)
-
Operational complexity permanently increases
-
Service levels have expanded beyond the original pricing model
-
Historical pricing no longer supports viable margins
The implementation timeline affects acceptance significantly. Permanent increases need 60-90 days notice for contracted clients. Temporary surcharges can deploy with 30 days warning for specific date ranges.
-
Monitor trigger thresholds weekly
-
Flag patterns persisting beyond 30 days
-
Implement temporary surcharge at 45 days
-
Evaluate permanent adjustment at 90 days
-
Convert surcharge to base pricing at 120 days if conditions persist
This graduated approach lets you respond quickly while giving operations time to find efficiencies that might avoid permanent increases altogether.
Seasonal recalibration workflows and timing
Catering demand patterns create natural windows for pricing recalibration. Miss these windows and you end up making reactive pricing changes during busy periods when neither operations nor clients have flexibility for surprises.
January recalibration (post-holiday reset):
-
Analyze Q4 margin performance when demand peaked
-
Incorporate annual vendor contract changes
-
Adjust for minimum wage or regulatory changes
-
Update cost cards with new baseline expenses
-
Set Q1-Q2 pricing for spring events
April adjustment (pre-wedding season):
-
Review Q1 margins during the slower period
-
Update social event pricing before peak bookings
-
Adjust staffing costs based on the current hiring market
-
Modify venue-specific surcharges from Q1 learning
-
Lock in May-September premium event pricing
September review (pre-corporate Q4):
-
Evaluate summer event profitability
-
Update corporate catering rates for budget season
-
Incorporate lessons from the peak operational period
-
Adjust holiday surcharges based on prior year performance
-
Set October-December corporate pricing
November preparation (next-year planning):
-
Build next year's baseline cost cards
-
Establish annual contract pricing for recurring clients
-
Define holiday blackout dates and premiums
-
Update operational capacity assumptions
-
Create Q1 promotional pricing if needed
Each recalibration needs a defined workflow, not random adjustments. Pull margin reports for all events in the prior period, broken out by event type. Identify which categories consistently missed margin targets. Then trace through operational reports to figure out whether food costs, labor overruns, or operational complexity drove the misses.
The change order workflow you use for client requests is a useful model for internal pricing changes too. Document what changed, why it changed, who approved it, and how it affects forward pricing. This audit trail prevents pricing chaos when multiple people are quoting events.
Worked recalculation examples across event types
Scenario 1: Protein costs spike 15% affecting wedding packages
-
Original wedding package cost card (100 guests)
-
Protein component
$12 per person
-
Other food costs
$14 per person
-
Labor and operations
$18 per person
-
Total cost
$44 per person
-
Current price at 30% margin
$62.86 per person
After protein spike:
-
Protein component
$13.80 per person (+$1.80)
-
Other food costs
$14 per person (unchanged)
-
Labor and operations
$18 per person (unchanged)
-
Total cost
$45.80 per person
-
Required price at 30% margin
$65.43 per person
Implementation decision:
-
Temporary surcharge for next 60 days
$3 per person "market adjustment"
-
Menu engineering to reduce protein portion by 15%
-
If spike persists beyond 60 days, permanent increase to $65
Scenario 2: Overtime consistently hitting 25% for Sunday brunches
-
Original Sunday brunch labor model (75 guests)
-
Base service labor
4 staff × 5 hours × $18 = $360
-
Assumed overtime
10% = $36
-
Total labor cost
$396 ($5.28 per person)
Actual operational data:
-
Base service labor
4 staff × 5 hours × $18 = $360
-
Actual overtime
25% = $90
-
Real labor cost
$450 ($6 per person)
Pricing adjustment:
-
Immediate
Add $1 per person to Sunday pricing
-
30-day evaluation
Adjust staffing model to reduce overtime
-
Alternative
Implement Sunday minimum guest count of 100
-
Final option
Eliminate Sunday brunch offerings
Scenario 3: December corporate deliveries require rush charges
-
Standard corporate delivery cost structure
-
Food cost
$11 per person
-
Standard prep/service
$3.50 per person
-
Normal delivery
$2 per person
-
Total operational cost
$16.50 per person
-
Standard price at 35% margin
$25.38 per person
December surge reality:
-
Food cost
$11.50 per person (vendor rush charges)
-
Rushed prep/service
$4.80 per person (overtime)
-
Priority delivery
$3.20 per person (limited vehicles)
-
Total operational cost
$19.50 per person
-
Break-even price
$30 per person
Surge pricing implementation:
-
December 1-23
20% surge on all corporate deliveries
-
December 24-31
35% surge or blackout dates
-
Minimum order increases from $200 to $350
-
Advance booking requirement extends from 48 to 72 hours
These calculations show why systematic recalculation beats intuition. The Sunday brunch problem might feel like a scheduling issue, but the math might reveal that pricing—not staffing—needs to move. December surge pricing might seem aggressive until you actually calculate operational costs during that period.
Technology integration and workflow automation
Manual pricing systems break down as volume scales. Even disciplined operations struggle to maintain pricing consistency when multiple people quote events, costs shift weekly, and clients request modifications constantly.
-
Vendor cost feeds Your pricing system pulls current costs directly from vendor systems or purchase history. When chicken breast prices change, every cost card using that ingredient updates automatically.
-
Labor tracking integration Actual hours from timekeeping systems feed back into cost cards, replacing estimates with operational reality. If setup consistently takes 3 hours instead of the estimated 2, the system adjusts.
-
Margin monitoring dashboard Real-time margin calculation for every event, comparing quoted margins to actual performance. Patterns become visible immediately, not at the end of the quarter.
-
Quote generation engine Sales team works from current cost cards and pricing rules, not six-month-old spreadsheets. The system enforces minimum margins and required surcharges automatically.
-
Client communication templates When pricing changes trigger, the system generates client notices with consistent messaging and appropriate notice periods.
AI-powered operational software adds another layer here—identifying patterns that are easy to miss when you're in the middle of running events. When Tuesday deliveries to downtown addresses consistently underperform, the system surfaces the pattern and flags it for review. When specific menu combinations create operational complexity, pricing recommendations can start reflecting that reality rather than waiting for someone to notice.
The goal isn't removing human judgment from pricing decisions. It's giving your team accurate, comprehensive operational data to make those decisions with—instead of relying on whatever they remember from last quarter.
Making pricing defensible to clients
A systematic pricing system does more than protect margins—it makes price changes explainable when clients push back. When you can show detailed cost calculations and operational data, the conversation shifts from negotiation to explanation.
-
Date of last price adjustment for this service
-
Specific cost increases driving the current change
-
Operational improvements attempted before touching pricing
-
Market comparison data for similar services
-
Value additions included despite the price increase
This documentation becomes genuinely useful during client conversations. Instead of vague references to "increased costs," you can say: "Protein costs are up 18% since your last event, labor costs are up 12% due to market conditions, and this specific venue requires two additional setup hours based on our last three events there."
Transparency builds trust even when you're raising prices. Clients might not love paying more, but they respond differently when the operational reality is laid out in front of them. It also keeps sales teams from making unauthorized concessions that quietly destroy margins.
Pricing as operational strategy
Building a KPI-linked catering pricing system turns one of your most critical business decisions from guesswork into something you can actually manage. When cost cards reflect true operational requirements, margin thresholds protect profitability, and triggers flag necessary adjustments before things get ugly, pricing becomes proactive rather than reactive.
The compound effect matters more than any single pricing decision. A systematic approach might only improve margins by 3-4% initially, but that improvement scales across every event. For a catering operation running 200 events annually at an average of $3,500 per event, a 3.5% margin improvement generates around $24,500 in additional profit—without adding a single new client.
More importantly, systematic pricing creates operational confidence. Your sales team quotes events knowing the pricing actually supports profitable execution. Operations plans staffing and purchasing based on reliable margin targets. Management makes strategic decisions from accurate profitability data rather than hoping the numbers work out.
The catering businesses that hold up over the next decade will be the ones that treat pricing as an operational system rather than a sales tactic. They'll know their true costs, monitor margins continuously, and adjust based on data instead of gut feel. The question isn't really whether to build this system—it's whether you build it before margin pressure forces your hand.
Ready to elevate your catering business?
Join 500+ caterers trusting Caterngly to save time, reduce errors, and deliver flawless events.