

Running multiple catering events across town often means more driving than setup time. Effective route optimization for catering must account for hot-item timing, loading sequences, venue access rules, and staff schedules across multiple vehicles.
Generic delivery platforms treat a large wedding the same as a pizza dropoff; they rarely model temperature zones, setup durations, or chained service times. Purpose-built catering and event management software fills that operational gap.
Software and integration checklist for catering and event management buyers
Before evaluating platforms, confirm the product meets these capability areas. Gaps in any of them create distinct operational failure modes.
Scheduling and routing
-
Scheduling engine that handles multi-stop days with competing service-time constraints
-
Time-windowed route optimizer (VRP-TW) rather than distance-only routing
-
Capacity constraints across volume, weight, and equipment footprint
-
Manual override and drag-to-reschedule interface for day-of changes
Mobile and field operations
-
Mobile driver app with live ETA, proof-of-delivery photo capture, and signature collection
-
Offline mode for venues with poor connectivity
-
Push notifications for route changes and emergency re-routing
Temperature and compliance
-
Temperature-sensor integrations via IoT webhooks or device APIs
-
Alert thresholds and escalation rules per vehicle food zone
-
Recordkeeping exports for compliance reviews
Integrations and data exchange
-
Inventory, KDS, and POS sync to avoid over-promising unprepped items
-
Calendar sync with Google and Outlook for event coordinators
-
Open APIs and webhooks for bookings, telemetry, and third-party tools
-
Manifest and label printing from the routing interface
Access and reporting
-
Role-based access so drivers, coordinators, and owners see appropriate views
-
Operations dashboard with on-time %, capacity utilization, and per-route cost summaries
Pair this checklist with your catering digital operations architecture plan to sequence integrations.
APIs and data fields to exchange between your booking system and routing engine
Each stop record synced into the routing engine should include a consistent set of fields. Missing fields cause day-of manual corrections.
End chaos with centralized catering management.
Caterngly helps you plan, confirm, and manage every catering event seamlessly.
- Unified event and order management
- Real-time client updates
- Staff and resource scheduling
No credit card required
| Field | Purpose |
|---|---|
| event_id | Unique identifier to prevent duplicate stop creation |
| venue_id | Links to your venue master record (dock hours, access notes) |
| service_time | Hard deadline — the moment food must be on the table |
| setup_duration | Minutes required on-site before service_time |
| required_equipment | List of items needing space or power at the venue |
| temperature_zone | hot / cold / frozen / ambient — drives vehicle zone assignment |
| contactname / contactphone | On-site contact for access and escalation |
| dockwindowstart / dockwindowend | Loading dock availability window |
| insurancerequiredflag | Boolean — triggers certificate verification workflow |
| pax_count | Guest headcount — affects pack quantity and vehicle capacity calculation |
| special_instructions | Free-text field that travels with the manifest to the driver |
Keeping these fields consistent eliminates manual re-entry errors. See the integrations and post-event reconciliation playbook for mapping guidance.
Why standard delivery routes fail for caterers
Catering is orchestration, not simple delivery. Different events have immovable service times; missing a service window harms reputation more than extra mileage ever will.
Geographic proximity is misleading when venue-specific constraints exist — freight elevators, permit lead times, union handling — any of which can turn nearby stops into long delays.
Temperature management and loading sequence compound the problem. Hot items lose quality over time, cold items need active cooling, and a poor pack order forces repeated truck reorganizations that cascade into late arrivals.
Geographic clustering by event windows, not just distance
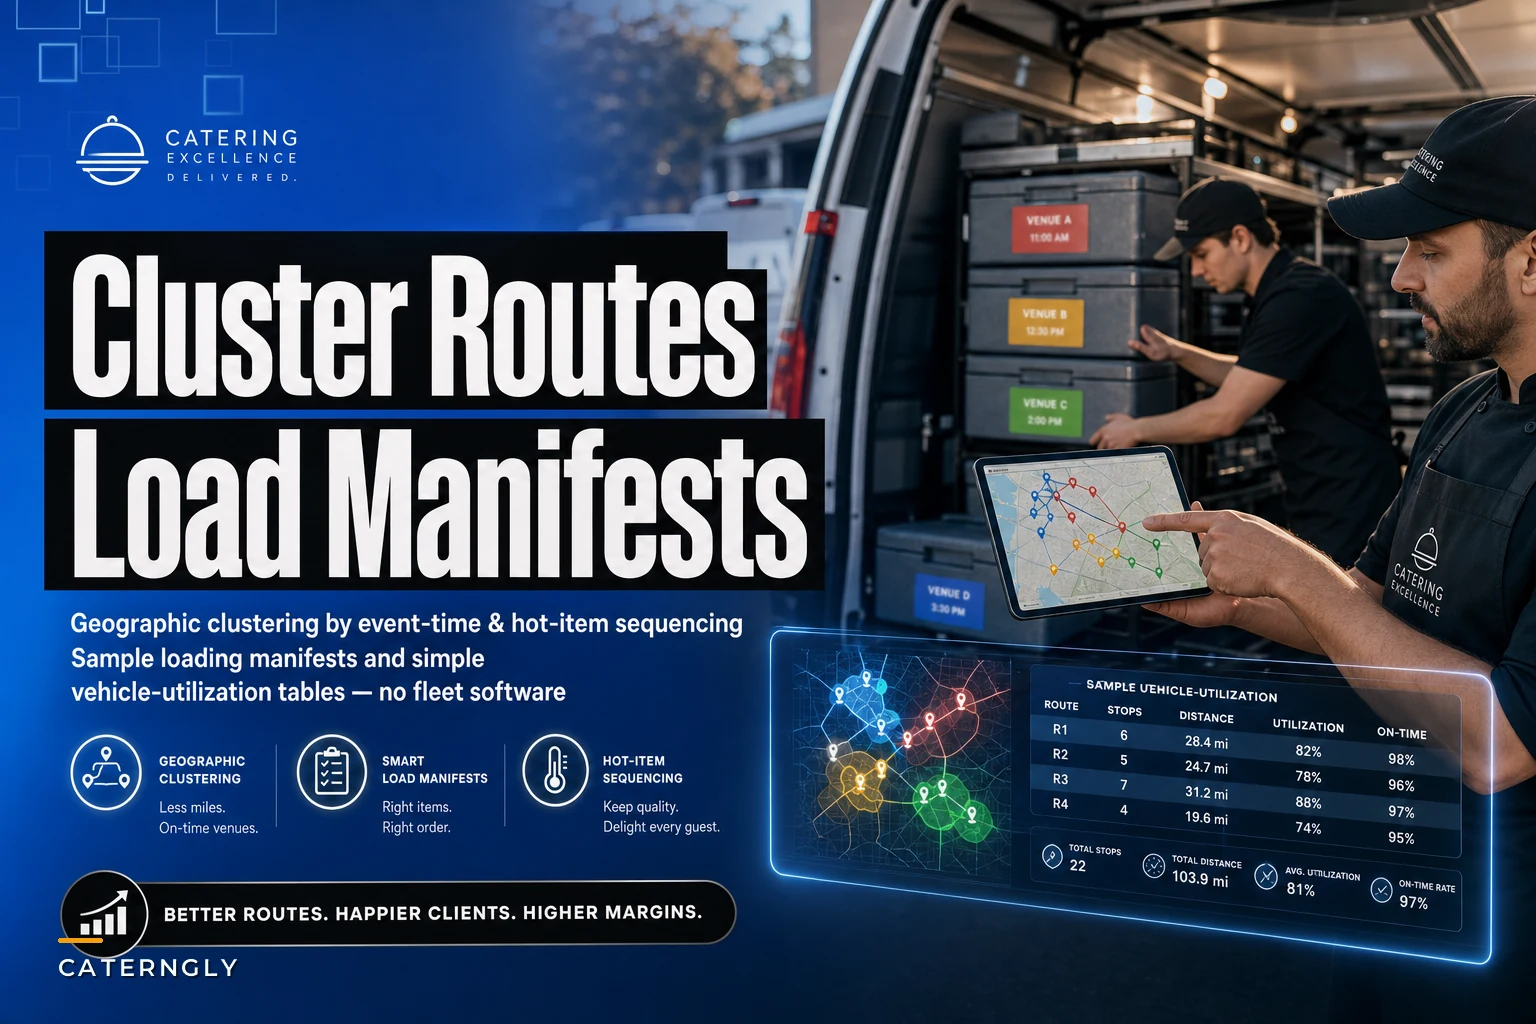
Cluster deliveries by compatible service time windows and work backward from servicetime using setupduration to determine arrival and departure times.
-
Map events by critical arrival times and group compatible windows, even if geographically scattered
-
Build time-based zones across your service area (e.g., downtown 11
00–13:00)
-
Add venue-specific delay buffers (e.g., hand-carry staircases, union handling)
-
Reserve transition buffer zones (30–45 minutes) between clusters for reset tasks
This time-window-first clustering prevents routes that stall because a dock window opens later or a venue requires extra handling.
Hot-item priority sequencing that prevents temperature disasters
Temperature-sensitive items should drive sequencing decisions. Categorize items by their holding tolerance and sequence deliveries accordingly.
-
Categorize every menu item by its temperature tolerance window
-
Deliver hot proteins later within each cluster; ambient items earlier
-
Equip each vehicle with backup heating and extra ice (budget ~20–30% extra capacity)
-
Track temperature incidents by item and position to refine packing and routing
Connect holding-time failures to reorder and safety-stock rules so temperature incidents also feed inventory adjustments.
Loading manifests that eliminate venue chaos
A reverse-loading manifest (last delivery loads first) creates natural access order and reduces onsite reorganization.
| Field | Example value |
|---|---|
| Stop order | 3 of 4 (loads first, unloads last) |
| Bundle ID | BDL-007 |
| Load-bay position | Rear-left |
| Color tag | Blue (Morrison wedding) |
| Items list | Chafing dishes ×4, sterno ×12, prime rib tray ×2 |
| Temperature zone | hot |
| Special handling notes | Do not stack — fragile lid |
Color-code by venue so all items for one event share a tag. This lets any team member quickly match loads to stops without inspecting every label.
Standardize vehicle zones for item categories (e.g., rear-left for hot, right for cold, center for equipment) so loading is consistent across crews.
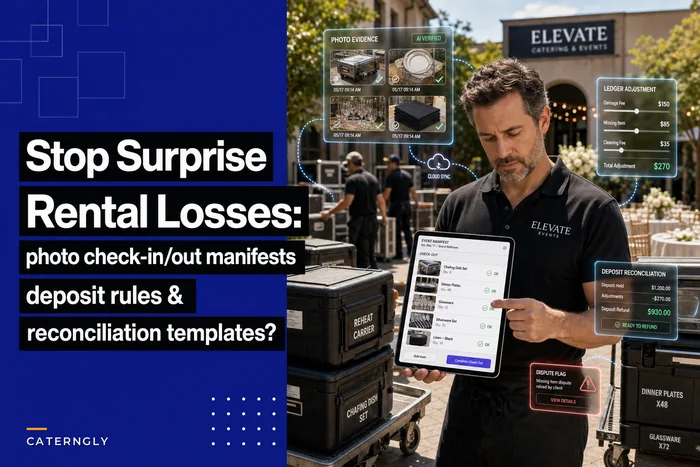
Photograph equipment condition at load-out and return to close equipment accountability using the process in the rental photo check-in/check-out guide.
Time-block routing: a worked example (3 downtown lunches)
This worked example shows backward scheduling for three downtown lunches. Adjust durations to match your venue data.
| Event | Service time | Setup duration | pack_time needed | Venue dock window |
|---|---|---|---|---|
| Lunch A (bread, beverages) | 11:30 AM | 20 min | 15 min | 9:00 AM – 12:00 PM |
| Lunch B (salad station) | 12:00 PM | 30 min | 20 min | 10:00 AM – 1:00 PM |
| Lunch C (hot protein) | 12:15 PM | 45 min | 25 min | 8:00 AM – 11:00 AM |
Work backward from each service time to determine latest kitchen departure. Account for drive time and dock-window constraints when computing depart times.
Result: Lunch C loads first (arrives earliest); Lunch A loads last so it unloads first at the front of the vehicle.
| Time | Action | Vehicle | Buffer |
|---|---|---|---|
| 9:00 AM | Kitchen pack starts (all three events) | Van #1 | — |
| 10:00 AM | Load complete, pre-departure check | Van #1 | 15 min |
| 10:15 AM | Depart for Lunch C | Van #1 | — |
| 10:55 AM | Arrive Lunch C, begin 45-min setup | Van #1 | 5 min to dock close |
| 11:10 AM | Depart for Lunch A | Van #1 | — |
| 11:10 AM | Arrive Lunch A, begin 20-min setup | Van #1 | — |
| 11:30 AM | Lunch A served ✓ | Van #1 | — |
| 11:35 AM | Depart for Lunch B | Van #1 | — |
| 11:35 AM | Arrive Lunch B, begin 30-min setup | Van #1 | — |
| 12:00 PM | Lunch B served ✓ | Van #1 | — |
| 12:15 PM | Lunch C served ✓ (kitchen left in advance) | Van #1 | — |
Backup trigger rule: if Van #1 has not departed by 10:20 AM, activate Van #2 to cover Lunch C independently. Pre-brief the backup driver each morning.
Copy this block schedule into a whiteboard, shared sheet, or your scheduling board as a reusable template for similar days.
Simple vehicle utilization tables without expensive software
Track vehicle efficiency in spreadsheets with columns for vehicle ID, events, departure/return times, mileage, and capacity %. Patterns will emerge after a few weeks.
| Vehicle | Monday events | Capacity used | Miles | Hours active | Cost per event |
|---|---|---|---|---|---|
| Van #1 | 3 lunches | 75% | 47 | 6 | $31 |
| Van #2 | 1 wedding | 95% | 28 | 8 | $95 |
| Box Truck | 2 corporate | 60% | 52 | 7 | $58 |
Suggested capacity % formula (volume-based):
capacity_used % = (total item volume loaded ÷ vehicle rated cargo volume) × 100
You can also check by weight: (total load weight ÷ vehicle payload rating) × 100. Use whichever constraint binds first.
Cost per event formula (spreadsheet-friendly):
costperevent = (fuel cost + driver labor hours × hourly rate + vehicle depreciation allocation) ÷ number of events on that vehicle that day
Include fuel cost = miles × fuel cost per mile and depreciation allocation = annual vehicle cost ÷ estimated annual operating days ÷ average events per day. Connect outputs to per-event P&L rules.
When to automate: a decision framework
Use measured thresholds as a starting point to decide whether to buy software. Capture baseline metrics first.
Metrics to track before making a software buying decision
-
Events per day (current and 90-day trend)
-
Repeat stops % (share of recurring venues)
-
Average route duration vs planned duration
-
Percentage of temperature incidents per week
-
On-time arrival % per block
Signals that manual coordination is becoming the constraint
-
Running ~8–10+ events per day across multiple vehicles
-
High repeat stops % but still re-planning routes weekly
-
Rising temperature incident rate without prep issues
-
Coordinators spending >90 minutes/day on route building
Recommended decision path: run a two-week manual pilot, capture baseline numbers, then prioritize platform features based on primary failure modes (repeat stops vs temperature incidents).
Time-block routing for multi-venue chaos
Divide the service day into rigid time blocks aligned to traffic and venue schedules, assign vehicles by sector, and build buffers between blocks.
-
Morning block (e.g., 7
00–10:30) for breakfast and early lunch setups
-
Midday block (e.g., 10
30–14:00) for lunch service
-
Evening block (e.g., 16
00 onward) for dinner events with a 20-minute buffer between blocks
Assign backup vehicles for overflow between blocks so unexpected clusters are covered without disrupting earlier commitments.
Real venue access constraints that routing software ignores
Maintain a venue master record documenting real-world access requirements; routing plans should reference this canonical data.
Recommended venue master record fields
-
Venue name and address
-
Loading dock hours (by day)
-
Elevator / stair notes and freight elevator contact
-
Permitted vehicle types and size restrictions
-
Required paperwork and reservation process
-
On-site contact name and cell number
-
Union handling notes and wait-time estimates
-
Last verified date
Document dock variability, required insurance certificates, and elevator/stair constraints. Verify vendor paperwork 72 hours before events.
Coordinating drivers, setup crews, and kitchen timing
Work backward from each service_time to set kitchen completion deadlines so trucks can load on time.
Use a visible communication board that shows vehicle assignments, load times, and responsibilities; update it immediately when plans change.
Separate delivery from setup where possible: drivers focus on safe, efficient transport; setup crews handle on-site arrangement. Use a simple checklist that travels with each delivery.
The catering operations playbook with RACI and modular SOPs provides templates for handoffs and escalation paths.
Building route optimization into your standard operating procedures
Convert routing insights into documented procedures so any team member can execute the plan.
-
Document clustering logic, time blocks, and loading sequences as step-by-step guides
-
Create route templates for common event combinations
-
Track route performance weekly and refine templates with data
-
Build seasonal variations and preventive maintenance into SOPs
Link inventory variances and route performance to your multi-event reorder and pooled ordering playbook so operational learnings feed procurement.
The compound benefits of systematic route planning
Systematic routing increases deliveries per shift, aligns kitchen deadlines, and reduces onsite scrambling.
Customers experience fewer late or lukewarm deliveries, improving reputation—especially with corporate accounts that value consistency.
Operating costs decline through reduced fuel, fewer vehicle hours, and less overtime. Capture savings via post-event reconciliation to compare actual delivery costs to invoiced amounts.
A predictable system reduces burnout: when teams trust the plan, work shifts from firefighting to reliable execution.
Moving beyond manual routing coordination
Manual planning scales only so far—around the observed 8–10 events/day heuristic—after which complexity overwhelms coordinators.
Purpose-built platforms integrate route optimization with inventory, temperature monitoring, and customer communication and model setup times and venue constraints that generic tools ignore.
Start with manual systems, document what works, then introduce automation where it delivers measurable ROI. Use the checklist at the top of this article when evaluating platforms.
How to pilot these systems: a two-week manual checklist
Run a structured two-week manual pilot to create a before-state baseline and measure whether automation will improve performance.
Week one: capture
-
Record events per day, vehicles deployed, and planned vs actual departure times
-
Log every temperature incident with timestamp, item, vehicle, and route position
-
Measure on-time arrival % per time block
-
Track vehicle utilization % using capacity formulas
-
Note every venue access delay with cause and duration
Week two: identify patterns
-
Calculate average route duration vs planned duration per block
-
Identify stops that consistently cause overruns and why
-
Measure repeat stops % week over week
-
Flag routes where temperature incidents cluster
After the pilot, compare on-time %, temperature incidents, and cost per event before and after implementing time-block and reverse-load changes. Use those numbers to scope an RFP with specific performance targets.
Surface pilot findings in your KPIs dashboard so route performance becomes a standing metric alongside per-event profit.
Route optimization for catering determines whether you scale profitably or remain trapped in operational chaos. Build systems now while you can experiment; they will carry you through growth.
Ready to elevate your catering business?
Join 500+ caterers trusting Caterngly to save time, reduce errors, and deliver flawless events.