



The most common benchmarking mistake in catering is comparing your blended food cost to the "30% rule" and deciding you're fine.
That one number is an average of very different businesses. A caterer running corporate drop-off, social buffets and a few plated weddings is operating three businesses that share a kitchen, and each has its own economics. A 31% blended food cost can hide a drop-off channel at 26% and a buffet channel at 38%. The owner sees an acceptable number, keeps booking buffets, and wonders why the bank balance doesn't match the busy calendar.
It goes the other way too. An operator who does mostly plated weddings looks at 34% food cost on a corporate lunch program and panics. For that channel at that size, 34% is roughly normal.
This article lays out catering KPI benchmarks by channel and operator size, as bands rather than single targets. It covers how to normalize your numbers so the comparison means something, how to read an outlier, and what to do about each type. The bands come from patterns across operators, not a formal industry survey. Your market, labor rates and menu positioning will shift them, so there's a section near the end on setting your own.
Three ways the single-benchmark mistake shows up
Comparing yourself to "the industry." Industry averages lump together hotel banquet departments, contract foodservice, food trucks doing private events, and five-person social caterers. A lot of the numbers floating around online come from restaurant data, and restaurants behave nothing like off-premise catering. A restaurant's labor clock runs on covers through a fixed room. A caterer's runs on drive time, venue access windows and how long the toasts go.
Comparing this month to last month, blended. Channel mix shifts with the seasons. Corporate work tends to dominate Q1 and Q4, and social and wedding work takes over from late spring through early fall. If blended labor jumps from 24% to 31% between March and June, that may be nothing but mix, since plated weddings carry more labor per dollar than drop-off. You can't learn anything until you split by channel.
Comparing yourself to a peer of a different size. A $500k owner-operator and a $4M caterer can both say "our labor is 27%" and mean completely different things. The small operator probably isn't counting their own 60-hour week. The larger one probably has a sales coordinator, an ops manager and a purchasing person sitting in overhead instead of event labor. The event-level numbers look alike, but the businesses underneath don't.
The fix is the same for all three: normalize first, then compare against the band for your channel and your size.
What "normalized" actually means for a caterer
Most KPI arguments inside catering companies are really arguments about the denominator. The chef calculates cost-per-cover one way, the bookkeeper another, the owner a third. Before any band means anything, lock three definitions.
End chaos with centralized catering management.
Caterngly helps you plan, confirm, and manage every catering event seamlessly.
- Unified event and order management
- Real-time client updates
- Staff and resource scheduling
No credit card required
Cost-per-cover: guaranteed count vs. served count
Cost-per-cover here means food plus consumables (disposables, sterno, liners, packaging) divided by guest count. Rentals and pass-through items stay out. The open question is which guest count.
| Measure | Calculation | Result |
|---|---|---|
| Cost per guaranteed cover | $2,140 ÷ 140 | ~$15.30 |
| Cost per served cover | $2,140 ÷ 128 | ~$16.70 |
| Food cost % (food portion priced at $48/guest) | $1,960 ÷ ($48 × 140) | ~29% |
| Guarantee-to-served gap | (140 − 128) ÷ 140 | ~8.5% |
Cost per guaranteed cover tells you whether your pricing is healthy, since that's what the client paid for. Cost per served cover tells you whether production is healthy. If the gap between them keeps landing above 5–8% in a channel, the kitchen probably isn't the problem. It's how guarantees get set and enforced, which is a sales and contract issue showing up in a food number.
Plenty of caterers only calculate against the invoiced count. That hides overproduction, because the denominator matches the revenue line and everything looks proportional.
Labor utilization: what counts as "event-attached"
Labor utilization is event-attached paid hours divided by total paid hours over a period, usually a week.
Event-attached means prep tied to a specific BEO, loading, travel, setup, service, breakdown, and return and wash-down for that event's equipment. It does not include general kitchen cleaning, inventory counts, training, the slow Tuesday where three people stayed on so they wouldn't quit, or the hour someone spent reorganizing the walk-in.
-
Total paid hours across hourly staff
~612
-
Hours tagged to specific events
~431
-
Utilization
~70%
-
Of those 431 event hours, on-site idle (waiting on venue access, long speeches, a late vendor blocking the loading dock): ~38 hours
Track that idle number separately. A channel can show decent utilization and still carry a lot of standing around, because the paid hours technically sit on an event. Plated weddings are the worst for this.
Waste per event: percent of produced food cost, plus dollars per guest
Weight-based waste tracking is more accurate, but most small operators won't keep it up. Dollar-based is enough: the estimated food cost of what got discarded, divided by the food cost of what was produced. Food intentionally repurposed into staff meal or another event doesn't count as waste. Food "repurposed" into the dumpster three days later does.
-
Plated wedding, 160 guaranteed produced about $3,050 in food cost, discarded about $142. Roughly 4.7%, or under $1 per guest. Normal, since plated counts are tight.
-
Corporate recurring lunch program, 85 projected produced about $690, discarded about $118, because only 64 people showed up. That's around 17%.
The second number looks alarming against a generic "keep waste under 5%" target. Against the band for recurring corporate programs it's still high, but the cause is attendance variance, not kitchen discipline. The remediation is completely different, as you'll see further down.
The bands: catering KPI benchmarks by channel
These are the core ranges, assuming a mid-size operator (roughly $750k–$3M revenue) in a mid-cost US market. Size adjustments come in the next section.
| Channel | Typical price/guest | Food cost % of food revenue | Cost-per-cover (food + consumables) | Labor % of revenue | Labor utilization | Waste (% of produced food cost) | Event contribution margin |
|---|---|---|---|---|---|---|---|
| Corporate drop-off | $16–$32 | 26–32% | $5.50–$10 | 12–20% | 72–85% | 2–5% | 32–45% |
| Corporate recurring program (office meals) | $14–$26 | 29–35% | $5–$9 | 16–24% | 75–88% | 5–11% | 24–34% |
| Social full-service (buffet / family style) | $40–$85 | 28–34% | $12–$24 | 24–34% | 55–70% | 6–12% | 24–36% |
| Plated weddings & galas | $80–$170 | 24–30% | $20–$42 | 28–38% | 48–64% | 3–7% | 22–34% |
| Venue in-house / exclusive caterer | $50–$120 | 27–33% | $14–$32 | 24–32% | 64–78% | 4–9% | 26–38% before venue commission |
A few things in this table tend to surprise people.
Plated weddings have the lowest food cost percentage and some of the lowest contribution margins. Labor eats the difference. Owners who only look at food cost end up over-investing in the wedding book, then can't work out why a fully booked June makes less than a moderate October.
Corporate recurring programs have high utilization and thin margins. The work is predictable, so labor schedules tightly, but pricing pressure never lets up and attendance variance creates waste you can't plan away. These programs pay the rent and keep the crew employed between social events. Judge them on contribution dollars per labor hour, not margin percentage.
Venue in-house utilization runs higher than off-premise because there's no travel and no unfamiliar load-in. If you're the exclusive caterer at a venue and your utilization looks like an off-premise operation's, something structural is off. Often it's scheduling built around old off-premise habits.
How these channels should be mixed and priced against each other is covered in the revenue operations and yield management system for caterers. The bands here are only about whether each channel is running healthily on its own terms.
How operator size shifts the bands
Size changes three things: purchasing leverage, how much management labor is hidden or exposed, and calendar density. Denser calendars let you schedule people more efficiently.
| KPI | Small (under ~$750k, owner on-site at most events) | Mid (~$750k–$3M) | Larger (~$3M–$10M, multiple crews) |
|---|---|---|---|
| Food cost % | +1 to +3 pts vs. band (less purchasing leverage, smaller case sizes) | Band as shown | −1 to −2 pts with central purchasing; can drift up if satellite kitchens buy independently |
| Labor % of revenue | Often reads 4–8 pts low because owner hours are unpaid | Band as shown | Event labor at band or slightly better; indirect labor adds 8–12% of revenue |
| Labor utilization | Reads 5–10 pts high unless owner hours are included | Band as shown | +3 to +6 pts event-level from calendar density, if scheduling is centralized |
| Waste | Wider swings; one bad event moves the monthly number a lot | Band as shown | Tighter at central production; widens when multiple sites prep independently |
| Contribution margin | Looks strong, often misleading | Band as shown | Event-level looks good, so watch overhead absorption instead |
| What to watch hardest | Owner hours and true labor cost | Channel mix and guarantee gaps | Indirect labor and cross-site consistency |
The small-operator column matters most. If you're under $750k and working most events yourself, add your own hours to the labor numbers at whatever it would cost to replace you, even an event manager at $28–$35 an hour. Do this before comparing to any band. Otherwise your utilization and margins look excellent right up until you try to step back from events and find the business only worked because you were free labor.
At the larger end the problem flips. Event-level KPIs often look great because the people who make events run smoothly (ops managers, schedulers, purchasing) sit in overhead. Event margins land comfortably in band and company net margin is still thin. The per-event numbers aren't wrong, they're just not the whole picture. For a fuller allocation approach, see the profitability operating system for caterers.
Reading the bands without overreacting
Every caterer has events out of band. A 40-person drop-off where the client adds a last-minute charcuterie board with premium cheese will wreck cost-per-cover for that one event, and that's fine. The value here is in knowing when an outlier means something.
A few interpretation rules that hold up well:
One event out of band is noise until proven otherwise. Note it, look for an obvious cause, move on.
Three or more of the last eight events in a channel out of band in the same direction is a pattern. That's when you open a playbook. Eight is a workable window for most mid-size operators. Smaller operators with fewer events per channel can use the last five or six and live with more noise.
The same KPI out of band across multiple channels is a system problem. If cost-per-cover is high in drop-off and buffet and plated, look at purchasing, pricing updates or cost cards. Don't go hunting through three different menus.
Read KPIs in pairs, not alone. Most of the diagnostic value lives here:
-
High cost-per-cover + normal waste → you're serving more or more expensive food than the cost card assumed. Portion drift, unrecorded substitutions, or supplier price creep.
-
High cost-per-cover + high waste → overproduction. Count problems, buffer policy, or production planned off the wrong number.
-
Low utilization + normal labor % → you're probably underpricing labor in proposals, so a wasteful schedule still looks affordable on paper. This one's dangerous because it feels fine.
-
High utilization + rising overtime → the crew is maxed out. Next month's mistakes and turnover are already baked in.
-
Everything in band + margin below band → the problem isn't in operations. It's pricing, mix, or overhead.
The KPI dashboard post goes deeper on how per-event views surface profit leaks. The point here is narrower. An outlier read alone is easy to misread, and the pair tells you which playbook to open.
Outlier playbooks: what each condition usually means and what to do
These are organized by the condition you'll see on a dashboard, not by department. Each one gives what it usually means, what to check, then the fix.
Condition A: Cost-per-cover above band, waste within band
What it usually means: You're putting more value on the plate than you priced for. Waste is fine, so it isn't overproduction. Either portions crept up, ingredient costs rose without the cost card catching up, or substitutions happened that nobody charged for.
-
Pull the cost cards for the top five menu items in the affected channel and re-cost them against the last 30 days of invoices, not the last price you remember
-
Weigh three to five actual plated or panned portions against spec at the next event in that channel
-
Check whether any "free" substitutions were made for dietary requests or client asks without a price adjustment
-
Compare supplier unit prices month over month for the ten highest-spend ingredients in that channel
-
If cost cards were already accurate, check whether proposals are pulling from current cost cards or from an old template someone keeps copying forward
-
Set a re-costing trigger
any ingredient moving more than 8–10% from the cost card value prompts a recalc
Condition B: Cost-per-cover above band, waste above band
What it usually means: Overproduction. The kitchen is making more than gets eaten, and the excess is going in the trash instead of being caught as leftover inventory.
-
Confirm which count each production sheet was built from (initial inquiry, RSVP, final guarantee, or kitchen estimate)
-
Write down a single buffer policy by channel and service style, and make sure only one person applies it
-
Look at the guarantee-to-served gap over the last eight events. If it's consistently over 8%, the issue is upstream, in contract terms or in how guarantees are collected
-
For buffets, check whether replenishment is staged in waves or everything goes out at once
-
Track what's left on the return run
cooked and unserved, versus raw and returnable
Condition C: Cost-per-cover below band
This one gets celebrated when it should get investigated.
What it usually means: Most often it's a data problem. Inventory got pulled from house stock without being logged against the event, so the event looks cheaper than it was. Next most common is portions under spec, which shows up in client feedback a few weeks later rather than in the numbers. Occasionally it's real, because a menu item got re-engineered or a supplier deal landed. You should know which.
-
Check whether house-stock pulls (oils, spices, dairy, bread, garnishes) are being charged to events or sitting in a general kitchen cost bucket
-
Compare the event's cost-per-cover to its menu's theoretical cost from the cost card. If actual is well below theoretical, something's unrecorded or under-portioned
-
Look for client feedback mentioning portion size, running out, or "not enough" on events in the same channel
-
If it's genuinely a better cost structure, update the band for that channel so the new level becomes the baseline
Condition D: Labor utilization below band
What it usually means: The schedule's structure doesn't fit the work. It's rarely about people being slow.
-
Break call times into at least two waves for any event over 75 guests
setup crew, then service crew
-
Compare scheduled headcount to what you'd actually need if everyone showed up. If you're always scheduling one or two extra as no-show insurance, track your real no-show rate for a month first
-
Separate on-site idle time from productive event time and look at which events drive the idle hours
-
Check travel time as a share of event-attached hours. If it's above roughly 20–25% for a channel, look at route clustering or a staging location
-
For small drop-offs, test combining two or three deliveries per driver run instead of one driver per event
-
Look at non-event hours
training, deep cleans and inventory counts can be scheduled into slow days on purpose rather than filling idle time by accident
Condition E: Labor utilization above band
What it usually means: The crew is stretched. Above 88–90% utilization there's no slack for a late delivery, a sick call, or a client adding 20 guests on Thursday. It feels efficient. It's actually fragile.
-
Pull overtime hours by person for the last four weeks and check whether it's concentrated in a few people
-
Check whether prep is being moved to day-of because there's no time the day before
-
Look at whether you're quietly turning down or delaying inquiries because of capacity, without anyone actually deciding to
-
Identify single points of failure
roles only one or two people can cover
-
Consider whether that channel needs a price increase rather than a new hire. High utilization with thin margins often means the work is underpriced, not understaffed
Condition F: Waste above band, cost-per-cover within band
What it usually means: The waste is real, but you're pricing it in, or the channel structurally carries it. Corporate recurring programs are the classic case. Attendance varies, the client wants food for everyone just in case, and the price already absorbs some waste.
-
For recurring corporate programs, ask the client for actual attendance data or calendar signals (meeting schedules, office-day patterns) rather than a static headcount
-
Move to tiered quantities by day of week. A Monday and a Friday in a hybrid office are not the same lunch
-
Set up a standing agreement for unserved food
donated, sent home with staff, repurposed into tomorrow's staff meal
-
If waste is consistently above 10% in that channel, consider a minimum-plus-variable pricing structure so the client shares the attendance risk
Condition G: All KPIs in band, margin below band
The most frustrating one. Every event looks fine and the business still isn't making the money it should, which means the problem sits outside daily operations.
It's usually one of three things. The channel mix is tilted toward low-margin work. Overhead has grown without event pricing keeping up. Or there's a cost category nobody allocates to events at all, like vehicle costs, equipment depreciation or credit card fees on large invoices. You can't fix any of these from the kitchen. They're pricing and mix decisions, which is why the yield management and profitability posts linked earlier matter here.
What the dashboard should actually look like
Most catering dashboards fail the same way: the big number at the top is blended. Blended food cost, blended labor, blended margin. Everything useful is two clicks down, so nobody looks at it.
A channel band view puts the band, the rolling median and the outlier count up front. Something like this:
CHANNEL BAND VIEW — Mid-size operator — Rolling last 8 events per channel Cost/cover Labor util. Waste % Margin Corporate drop-off $7.40 79% 3.1% 38% band $5.50–$10 72–85% 2–5% 32–45% out of band (of 8) 0 1 ▼ 0 0 status OK OK OK OK Social buffet $21.80 58% 13.4% 23% band $12–$24 55–70% 6–12% 24–36% out of band (of 8) 1 ▲ 2 ▼ 4 ▲ 3 ▼ status watch watch PLAYBOOK B PLAYBOOK B Plated weddings $34.10 51% 5.2% 27% band $20–$42 48–64% 3–7% 22–34% out of band (of 8) 0 3 ▼ 0 1 ▼ status OK PLAYBOOK D OK OK
The status column ties the pattern to a specific playbook. The buffet channel above is showing Condition B: waste out of band on half the recent events, with margin following it down. The wedding channel is showing Condition D. Nobody has to interpret a wall of numbers, because the dashboard says which channel, which condition, which checklist.
A second view worth having is a pair view for a single channel over time. It plots cost-per-cover and waste on the same timeline so you can see whether they move together (overproduction) or separately (spec or price drift). Hard to show in a text block, but even a simple two-line chart in a spreadsheet does the job.
Leave revenue off the main view. It belongs on a sales dashboard. Put it next to operational KPIs and everyone starts excusing bad efficiency numbers because "we're busy."
The workflow that keeps the numbers honest
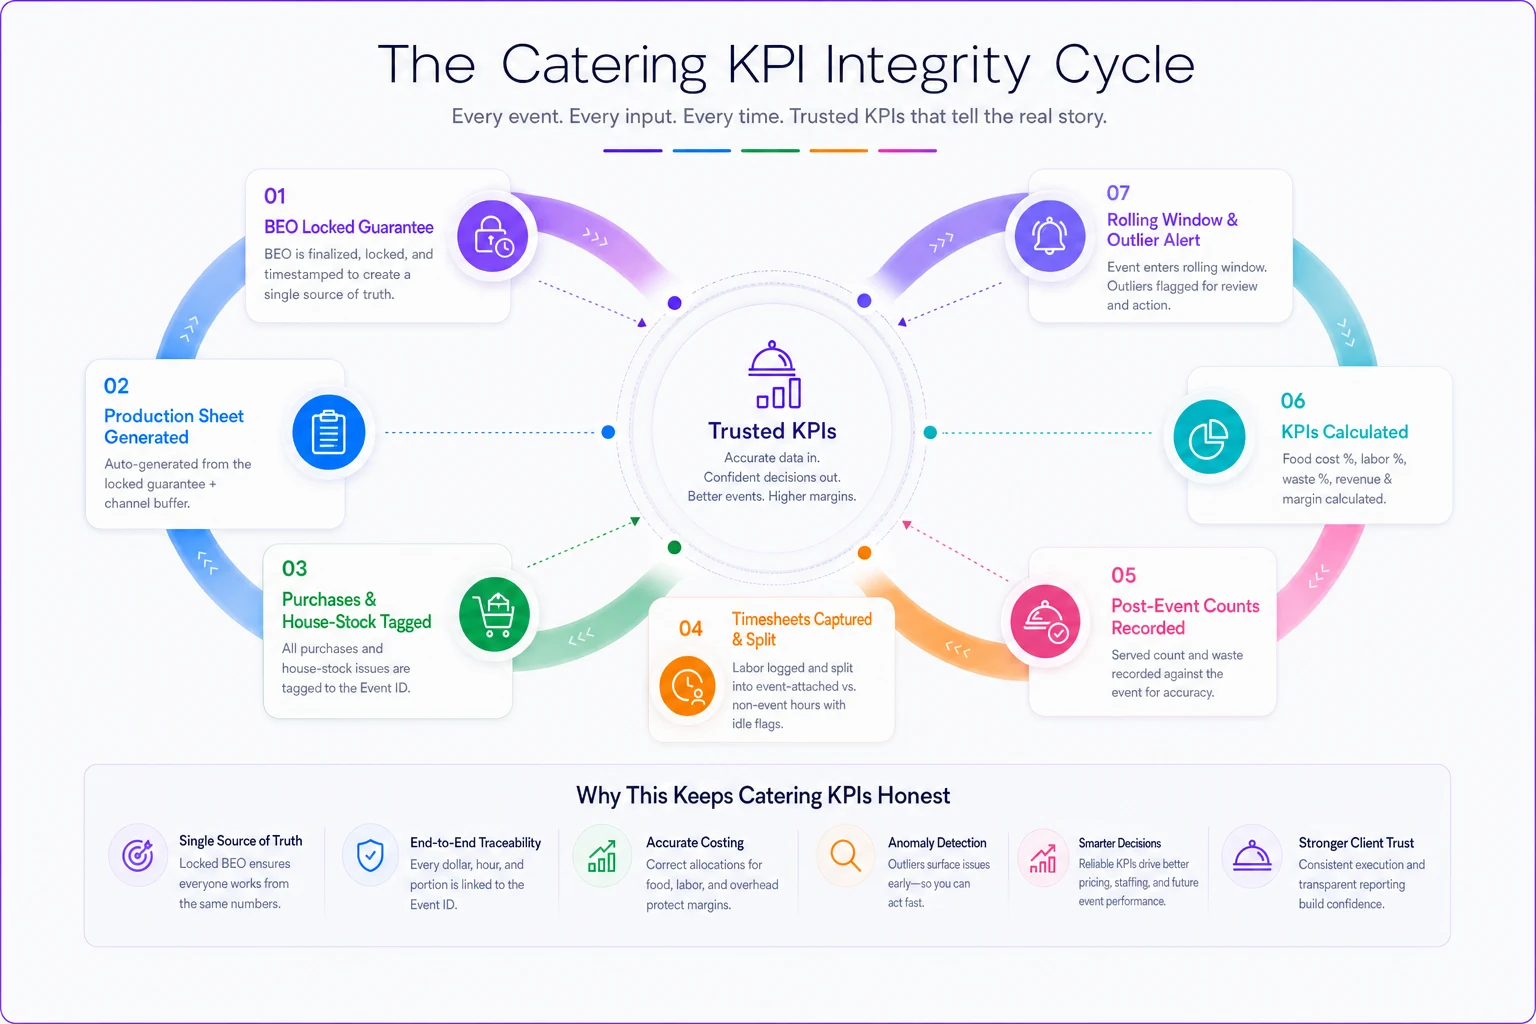
Bands are only as good as the data behind them, and in most catering operations the data breaks at the handoffs between sales, kitchen, crew and bookkeeping. Here's how the flow should work, in plain terms.
The BEO is finalized with a guaranteed count, and that count gets locked with a timestamp. Anything changed after that is logged as a change, not a silent overwrite. The production sheet is generated from the locked guarantee plus the channel's single buffer policy. Purchasing and house-stock pulls get tagged to the event ID as they happen, not reconstructed at month-end. Timesheets are clocked against event IDs, with at least a split between event-attached and non-event time, plus an idle flag the lead can mark on-site. After the event, the lead records the actual served count and a quick estimate of what was discarded versus returned. KPIs for that event get calculated within about 48 hours, while people still remember what happened. Then the event drops into its channel's rolling window, and if it pushes the outlier count to three, someone owns the playbook.
Keep a single buffer policy per channel and enforce it on production sheets so sales and kitchen don't apply buffers twice.
What breaks as the business grows
At small scale, the owner is the integration layer. They know the guarantee changed because they took the call, and they know Maria stayed late because they were there. The numbers are rough, but the owner's head fills the gaps.
Around the mid-size range that stops working. Sales and the kitchen are different people now. Staff float between channels in the same week, so labor allocation gets fuzzy. Somebody preps for a Saturday wedding and a Monday corporate program in the same Friday shift, and the timesheet just says "kitchen." House-stock pulls go unlogged because the shared kitchen serves everything. This is where blended numbers start actively misleading people, because nobody holds the full context anymore.
At the larger end, the breakage is cross-site. Two kitchens apply buffer policy differently, two event leads define "idle" differently, and the bands stop being comparable even within the same channel. The fix is boring but necessary: written definitions, a shared event ID, and one place where the numbers get calculated.
This is a natural spot for AI-powered operational software to help, and not because the math is hard. The tagging is tedious. Tagging purchases to events, splitting timesheets, pulling the locked guarantee, calculating the rolling window and flagging when a channel hits three outliers in eight is exactly the work that slips once a team gets busy. A platform that handles that automatically and surfaces which playbook applies keeps the system running in the weeks when nobody has time to update a spreadsheet. Those are the weeks the numbers matter most.
Real scenario: a mid-size caterer with a "healthy" blended food cost
Business type: Off-premise caterer, about $1.6M annual revenue, around 22 regular staff plus on-call servers. Three channels: corporate drop-off (most event count), social buffets and family-style parties, and roughly 30 plated weddings a year.
The problem: Blended food cost sat around 31%, which the owner considered fine. Margins felt thinner than they should be given how busy the calendar was, but nothing on the monthly P&L pointed to a cause.
What splitting by channel showed:
| Channel | Food cost % (before) | Waste % (before) | Labor utilization (before) |
|---|---|---|---|
| Corporate drop-off | ~27% | ~3% | ~80% |
| Social buffet | ~37% | ~14% | ~61% |
| Plated weddings | ~26% | ~5% | ~48% |
Drop-off was healthy. Weddings had fine food numbers but utilization at the bottom edge of the band. The buffet channel was way out on food cost and waste.
Diagnosis: The buffet channel was a textbook Condition B. Production sheets were built from RSVP counts plus a 10% kitchen buffer, while guarantees were often set 10–15 guests below RSVP. Sales got the lower number into the contract and the kitchen never saw it. On top of that, buffets went out all at once instead of in replenishment waves.
Weddings were Condition D. The full crew got called at the same time, usually five to six hours before service.
What changed: Production sheets switched to the locked guarantee with a single channel buffer of around 5%. Buffets moved to two-wave replenishment for anything over 80 guests. Wedding crews were split into a setup call and a service call roughly two and a half hours apart.
-
Social buffet food cost came down to roughly 32%, and waste to somewhere around 8%
-
Wedding labor utilization moved up to about 57–59%. On-site idle time dropped noticeably, and servers stopped complaining about four-hour waits
-
Drop-off was left alone, because it didn't need anything
The owner estimated the combined effect at somewhere in the $40k–$55k range annualized, mostly from the buffet channel. Blended food cost only moved about two points, which is a big part of why the problem had been invisible.
Setting your own bands
The ranges above are a starting point. Labor in a high-cost metro, a premium menu position, or a rural service area with long drives will push you outside them for reasons that aren't problems. After a quarter of clean data, set your own.
-
Lock your definitions first. Guaranteed vs. served count, what counts as event-attached labor, how waste is estimated. Write them down. If the definitions change mid-quarter, the bands are meaningless.
-
Tag at least one full quarter of events by channel. Don't reconstruct old events from memory. Start clean and accept that the first month is rough.
-
Calculate the median and spread for each KPI by channel. The middle 60–70% of your events, after dropping obvious one-offs with a known cause, is your working band.
-
Compare your bands to the reference ranges. Where you're outside them, decide whether it's structural (your market, your positioning) or a fixable problem. Be honest here. "Our market is different" is sometimes true and sometimes a convenient excuse.
-
Adjust for size. If you're a small operator, add owner hours before setting labor bands. If you're larger, decide whether you're tracking event-level or fully loaded numbers, and don't mix them.
-
Assign an owner for each channel's playbook. When a channel hits three of eight out of band, someone specific opens the checklist. Without an owner, outliers get noticed and then discussed forever.
-
Re-calibrate twice a year. Food prices, wage rates and your own mix all shift. Bands that never move end up either too loose to catch anything or too tight to be credible.
The ranges above are a starting point. Labor in a high-cost metro, a premium menu position, or a rural service area with long drives will push you outside them for reasons that aren't problems. After a quarter of clean data, set your own.
When this makes sense, and when it doesn't
When this actually makes sense
Channel-level bands earn their keep when you're running at least two distinct channels and doing enough volume in each to fill a rolling window: roughly six to eight or more events per channel per month, or a recurring program that generates daily data. They're especially useful right before a mix decision, like taking on a big corporate program or expanding into weddings, because they show what that channel will do to your crew and your margins.
They also help right after a growth spurt. That's when the owner's mental model stops matching reality and blended numbers start lying.
When this is a bad idea
If you're doing fewer than four or five events a month in a channel, the rolling window is too thin. One weird event swings the median, and you'll spend more time chasing noise than fixing anything. Track per-event P&L instead and look at trends over a longer stretch.
Don't build this before you've fixed basic data capture either. If purchases aren't tagged to events and timesheets just say "kitchen," you'll produce authoritative-looking bands out of guesses. That's worse than having no bands, because people will trust them.
Who should not do this
A single-channel boutique caterer is better off with a solid per-event P&L and close attention to pricing. Think of an operator doing three or four high-end weddings a month and nothing else. Channel normalization solves a problem they don't have.
Very early operators still figuring out what they sell should wait too. Bands are for running a business you already understand more efficiently, not for discovering what kind of business you are.
Where to go from here
If you only take one thing from this, split your numbers by channel before comparing them to anything. Most of the insight here comes from that step, and it costs nothing except a few hours of tagging.
After that, order matters. Lock definitions, get a clean quarter of data, read KPIs in pairs, and only open a playbook when a pattern shows up. Most operators who try this find one channel quietly subsidizing another, often buffets or weddings leaning on drop-off. The reaction shouldn't be to drop the weak channel. Look at which condition it's in and work through that checklist. Sometimes the answer is a production fix, sometimes a schedule fix. Occasionally it really is a pricing problem, and then the work moves from the kitchen to the proposal.
Re-check your bands in six months. They'll have moved, and that's expected.
If you only take one thing from this, split your numbers by channel before comparing them to anything. Most of the insight here comes from that step, and it costs nothing except a few hours of tagging.
After that, order matters. Lock definitions, get a clean quarter of data, read KPIs in pairs, and only open a playbook when a pattern shows up. Most operators who try this find one channel quietly subsidizing another, often buffets or weddings leaning on drop-off. The reaction shouldn't be to drop the weak channel. Look at which condition it's in and work through that checklist. Sometimes the answer is a production fix, sometimes a schedule fix. Occasionally it really is a pricing problem, and then the work moves from the kitchen to the proposal.
Ready to elevate your catering business?
Join 500+ caterers trusting Caterngly to save time, reduce errors, and deliver flawless events.