


Why most catering businesses can't answer basic cashflow questions
Why most catering businesses can't answer basic cashflow questions
Ask any catering owner what their cash position will look like in 90 days and watch them scramble through spreadsheets, booking calendars, and deposit notes. The answer usually comes back as a vague range followed by "depends on which events actually happen."
That uncertainty kills growth. Banks want concrete projections before approving equipment loans. Investors need visibility into seasonal patterns. Even basic decisions—hiring extra prep staff, upgrading kitchen equipment—become guesswork when you can't predict cash reliably.
The problem isn't just scattered data. Catering cashflow operates on three completely different timelines that standard accounting software wasn't built to handle. Your 30-day horizon runs on deposits and immediate costs. Your 90-day window depends on booking confirmations and vendor payment cycles. Your 12-month view needs to account for seasonal patterns, market shifts, and capacity constraints.
Most caterers try managing this with spreadsheets that break the moment reality gets complicated. A corporate event moves dates. A wedding doubles its guest count. Three events land in the same week. Suddenly your carefully planned cash position looks nothing like your projection, and you're back to reactive management.
The three-horizon framework: matching time windows to operational reality
The successful catering operations I've observed all do something similar—they split their catering cashflow forecast into three distinct models that each answer different questions. The ones still fighting fires tend to lump everything into one view, which creates either false precision or useless vagueness.
End chaos with centralized catering management.
Caterngly helps you plan, confirm, and manage every catering event seamlessly.
- Unified event and order management
- Real-time client updates
- Staff and resource scheduling
No credit card required
30-day horizon: Execution cash This window tracks money that's basically guaranteed. Events are locked, deposits collected, venues confirmed. You're monitoring execution, not probability. The main variables are final headcount adjustments and last-minute add-ons.
90-day horizon: Commitment cash Here you're tracking signed contracts that haven't hit their deposit milestones yet. Some events will cancel, some will modify scope, but you have enough certainty to make operational commitments. This is where you decide on staff scheduling, equipment rentals, and major food orders.
12-month horizon: Pipeline cash This projection relies on historical patterns, seasonal trends, and sales pipeline probability. You're not tracking specific events but rather event density—how many weddings typically book for next June, what corporate catering looks like in Q4, how graduation season affects May bookings.
Each horizon needs different data inputs, different accuracy expectations, and different update frequencies.
Building your 30-day execution model
The 30-day model should be bulletproof. Every event here has passed the point of no return—deposits collected, contracts signed, venues confirmed. But accuracy still depends on tracking the right operational markers.
Start with your deposit ladder. Map each event's payment milestones:
-
Initial deposit (typically 25-50% at signing)
-
Secondary payment (30-60 days before event)
-
Final balance (7-14 days before or day-of)
Then layer in your cost cascade. Food costs hit 7-10 days before events when you place orders. Labor costs lock in when you confirm staff schedules, usually 14 days out. Rental equipment gets reserved 2-3 weeks ahead.
-
Food orders usually placed 7-10 days before events
-
Labor schedules confirmed around 14 days out
-
Rental equipment reserved 2-3 weeks ahead
Here's what this looked like for a mid-sized caterer handling 18 events over 30 days:
| Week | Events | Deposits Due | Food Orders | Labor Locked | Cash Position |
|---|---|---|---|---|---|
| 1 | 4 events | $8,400 final | -$11,200 | -$4,800 | +$22,300 |
| 2 | 5 events | $12,100 final + $6,000 secondary | -$14,000 | -$6,000 | +$19,400 |
| 3 | 4 events | $9,200 final | -$11,200 | -$4,800 | +$18,600 |
| 4 | 5 events | $11,500 final + $8,000 secondary | -$14,000 | -$6,000 | +$21,900 |
Notice how cash position fluctuates even with steady event volume. Week 2 looks great on paper with five events, but the actual cash benefit doesn't hit until those final payments clear. Meanwhile, you're fronting costs for Week 3 and 4 events.
The trick is mapping these patterns to your actual payment processing delays. ACH transfers take 2-3 business days. Credit card processing might hold large deposits for verification. Some corporate clients pay on net-30 terms even for event catering.
One catering operation discovered they were consistently short on cash every third week of the month. Turned out their deposit structure created a timing gap—they required final payment 14 days before events, but most events clustered on weekends. So deposits for month-end events arrived just as they needed to pay for supplies for mid-month bookings. Simple problem, but it took mapping the 30-day flow to actually see it.
The 90-day commitment window
The 90-day model bridges locked bookings and probabilistic projections. Events here are "soft committed"—contracts signed but still within reasonable cancellation windows, deposits scheduled but not yet collected.
This window reveals your true operational capacity. You can see when multiple large events stack up, when quiet periods might strain cash reserves, when seasonal patterns start emerging.
Build your 90-day model around booking velocity and confirmation rates. Track:
-
Average days from inquiry to contract
-
Typical cancellation rate by event type
-
Deposit collection success rate
-
Scope change frequency (guest count modifications, menu upgrades)
A caterer specializing in corporate events might see something like an 85% contract-to-execution rate, average scope increases around 15% in final headcount, and about 60% of clients paying deposits on schedule—with roughly a quarter requesting payment term extensions. These percentages translate directly into cash projections.
If you have $180,000 in contracted events over 90 days, you're really looking at closer to $153,000 in executed revenue, potentially growing to $176,000 with scope increases, but with collection timing that could stretch your working capital.
The 90-day window also reveals concentration risk. One caterer I analyzed had 40% of their 90-day revenue tied to just three large corporate accounts. If any of those pushed payment terms or modified scope, cash would get tight immediately.
The 12-month strategic view
The 12-month model shifts from tracking specific events to understanding patterns and capacity. You're not predicting that the Johnson wedding will happen on June 15th—you're predicting that June will bring 20-25 weddings based on three years of data.
Build this model on event density patterns:
-
Historical monthly booking counts by event type
-
Average revenue per event category
-
Seasonal cost variations
-
Market growth or contraction trends
Don't try to be too precise here. The goal is understanding cash patterns, not predicting exact amounts. Will September be a cash-rich month because of fall weddings? Will January strain resources as corporate events dry up? When should you negotiate better terms with vendors based on volume?
Here's a simplified density model for a caterer doing $1.4 million annually:
| Quarter | Wedding Density | Corporate Density | Social Events | Projected Revenue | Cash Need |
|---|---|---|---|---|---|
| Q1 | 8-12 events | 15-20 events | 10-15 events | $280,000-$320,000 | High (post-holiday recovery) |
| Q2 | 35-40 events | 20-25 events | 20-25 events | $420,000-$480,000 | Medium (building season) |
| Q3 | 30-35 events | 10-15 events | 25-30 events | $380,000-$430,000 | Low (peak deposits) |
| Q4 | 15-20 events | 25-30 events | 15-20 events | $350,000-$400,000 | Medium (year-end push) |
This density approach helps you spot problems months in advance. If Q2 wedding inquiries are tracking 30% below historical patterns by February, you know to adjust labor commitments and vendor orders by March—not in May when it's too late to do much about it.
Connecting the three horizons
The real value comes when all three models talk to each other. Your 12-month density patterns inform your 90-day booking targets. Your 90-day confirmations feed your 30-day execution model. Each horizon provides checkpoints for the others.
To illustrate how the models connect in practice:
-
12-month model projects event density by quarter based on historical patterns
-
90-day model tracks signed contracts against those projections to surface gaps early
-
30-day model validates 90-day assumptions as execution approaches
-
Deviations at any level trigger adjustments to the other two horizons
Say your 12-month model projects 25 weddings for June based on historical patterns. By March, you should have 18-20 June weddings in various stages of confirmation. If you only have 12, something's wrong—either your sales process broke, competition increased, or market demand shifted. You have three months to figure it out rather than three weeks.
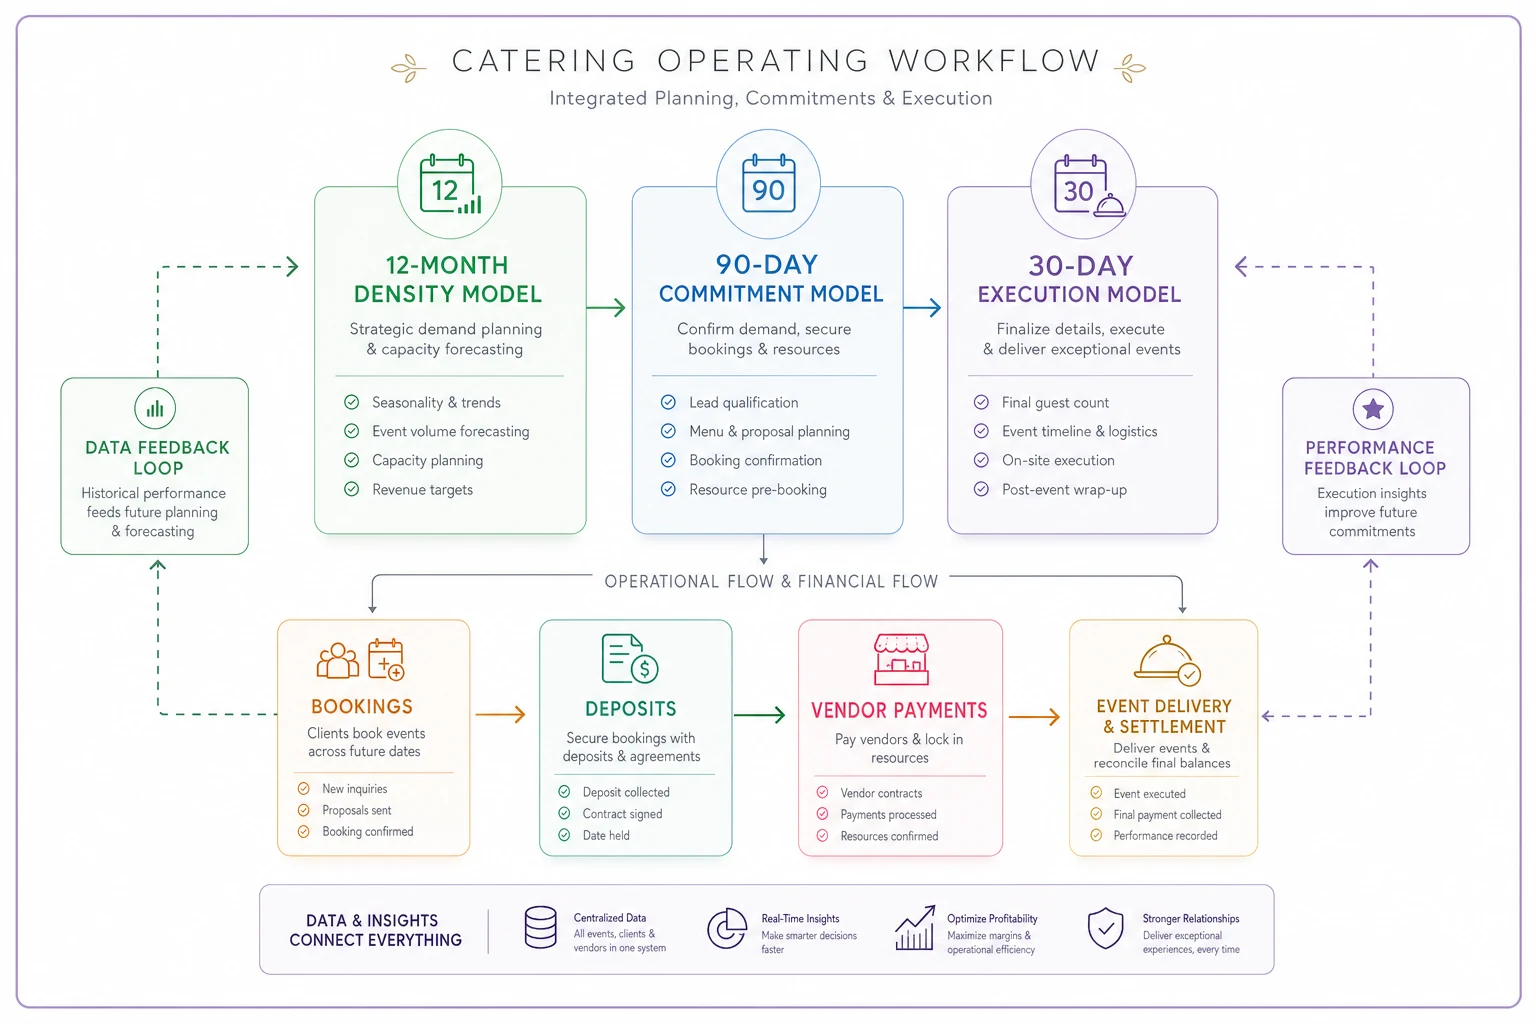
This diagram shows how the three horizons feed each other in practice.
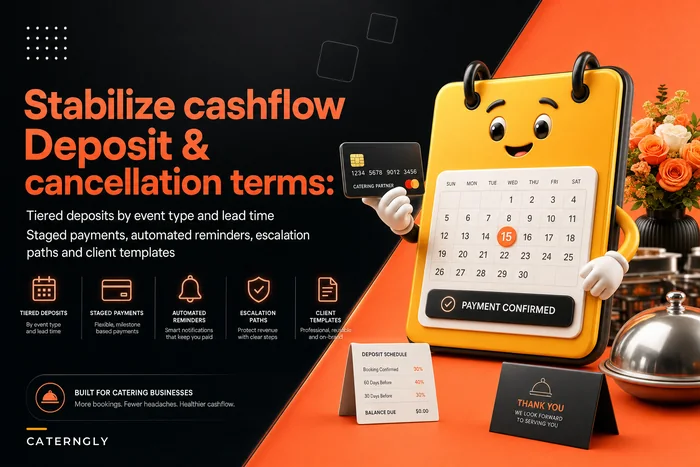
Similarly, your 30-day execution should validate your 90-day assumptions. If your 90-day model assumes 15% scope increases but your 30-day reality shows 25% increases, you need to adjust forward projections and probably revisit your deposit, payment schedule and cancellation terms that stabilize catering cashflow.
One caterer noticed their 30-day model showing consistent payment delays from corporate clients—stretching from net-30 to net-45 on average. That signal led them to adjust their 90-day projections and negotiate larger deposits for corporate bookings. Without that early warning from the execution data, they would've hit a cash crisis mid-busy season.
Managing the buffer calculation
Cash buffers aren't just about having "enough"—they need to match your operational reality across all three horizons. Your buffer needs shift based on event density, payment timing, and seasonal patterns.
For the 30-day window, your buffer should cover:
-
One week of operational costs (food, labor, rentals)
-
Payment processing delays
-
One major event cancellation or dispute
Most caterers need roughly 15-20% of monthly revenue as working capital for the 30-day window. So if you're doing $120,000 in monthly revenue, you need somewhere between $18,000-$24,000 in accessible cash.
The 90-day buffer gets more complex. You need to account for seasonal valleys in bookings, deposit collection delays, vendor payment requirements, and the occasional equipment issue that can't wait. This typically requires 25-30% of quarterly revenue. A caterer doing $400,000 per quarter should maintain $100,000-$120,000 in combined cash and credit access.
The 12-month strategic buffer is about surviving worst-case scenarios—loss of a major corporate account, an extended slow season, market disruption (the 2020 situation comes to mind), or a major equipment failure. This is where lines of credit become essential. You can't tie up enough cash to cover every possibility, but you need access to 2-3 months of operational costs if revenue disappears.
Creating lender-ready forecasts
Banks and investors don't care about your event calendar—they care about predictable cash generation. Your three-horizon model needs to translate into their language.
Start with cohort analysis. Group your events by size, type, and payment terms:
-
Small social events (under $2,000)
45% deposit, balance on delivery
-
Mid-size corporate ($2,000-$8,000)
30% deposit, net-30 payment
-
Large weddings ($8,000+)
40% deposit, 30% at 30 days, balance at 14 days
Show how each cohort flows through your three horizons. A lender can see that large weddings book 4-6 months out, confirm at 90 days with secondary deposits, and generate final cash at 30 days. That predictability matters more than total revenue volume.
Next, demonstrate seasonality management. Show how your model anticipates and prepares for seasonal swings. If December typically brings 40% of annual corporate catering revenue, explain how you build cash reserves in October and November to fund the increased operational costs.
Include stress testing. What happens if 20% of events cancel? If payment terms stretch by 15 days? If food costs spike 25%? Your model should show how each horizon absorbs and responds to these shocks. A catering company that secured a $200,000 equipment loan did it partly by showing their lender a stress test proving positive cash flow even with 30% revenue reduction—by adjusting labor and food orders based on 90-day forward visibility. That kind of documentation is what moves approvals.
Building your tracking system
The three-horizon model only works with disciplined tracking. You need different update cycles for each horizon and clear triggers for when to adjust projections.
Your 30-day model needs daily updates:
-
Payment received confirmations
-
Final headcount adjustments
-
Vendor invoice receipt
-
Staff hour confirmations
The 90-day model updates weekly:
-
New bookings added
-
Deposit milestone tracking
-
Cancellations or date changes
-
Scope modifications
The 12-month model updates monthly:
-
Booking pipeline analysis
-
Historical pattern comparison
-
Market condition assessment
-
Capacity utilization trends
This is where operational software makes a real difference. Trying to maintain three separate Excel models while running daily catering operations is basically unsustainable past a certain volume. AI-powered platforms can automatically populate these models from your booking system, flag variations from historical patterns, and alert you to brewing cash problems before they become urgent.
Automate deposit confirmations where possible to reduce manual errors.
The right system connects your catering cashflow forecast to actual operational data—pulling from event bookings, tracking payment milestones, monitoring vendor invoices, and calculating real-time cash positions. Instead of updating spreadsheets, you're focused on decisions: Should we take that last-minute corporate booking? Can we afford to upgrade refrigeration before summer? Is it time to renegotiate vendor payment terms?
Platforms built for this kind of work can also pattern-match your historical data to sharpen projection accuracy over time. They learn that your corporate bookings typically expand scope by around 20% but your wedding bookings stay flat. They catch months that consistently see payment delays. They flag when actual patterns diverge from projections early enough for you to do something about it. Connecting that data to your KPIs dashboard means you're not just tracking cash—you're tracking where the money actually went per event.
The compound effect of visibility
When you nail the three-horizon model, something interesting happens—your entire operation gets more profitable. It's not just about avoiding cash crunches or securing loans. The visibility changes how you make every operational decision.
You start turning down low-margin events during high-density periods because you can see better opportunities coming. You negotiate better vendor terms because you can guarantee volume three months out. You optimize staffing because you know exactly when you'll need extra hands.
One catering operation implemented this model and discovered they were consistently understaffed for Thursday events because all their attention went toward weekend prep. Shifting some prep work to Wednesdays—based on their 30-day visibility—cut Thursday overtime by roughly 40% without adding permanent staff.
Another caterer used their 12-month density model to identify that August consistently showed 25% lower margins despite similar revenue to July. Turned out August events required more cooling equipment and tent rentals. They adjusted August pricing by 8% the following year and margins normalized.
The three-horizon model also changes vendor relationships. When you can show suppliers your 90-day forward demand, they're more willing to lock in prices, extend payment terms, or hold inventory. Some caterers even negotiate retrospective volume discounts—hit certain purchase levels over a quarter and get a rebate on all purchases. That kind of arrangement is nearly impossible when you're operating month-to-month with no forward visibility.
The data feeding this system also makes post-event reconciliation faster and more accurate—because you're not reconstructing what happened after the fact, you already have the records to match against.
Making it sustainable
The biggest challenge with any catering cashflow forecast system is maintaining it when things get busy. The three-horizon model works because it matches your natural operational rhythm.
You're already tracking 30-day execution details because events are imminent. You're already monitoring 90-day bookings because that's your active sales pipeline. You're already thinking about 12-month patterns because that drives marketing and capacity planning. The model just structures what you're already doing into a format that answers cash questions.
Start simple. Don't try to build all three horizons at once. Get your 30-day execution model working first—that's where immediate cash lives. Once that's reliable, extend to 90 days. The 12-month view can wait until you have several months of solid data from the shorter horizons.
Precision isn't the goal—visibility is. A roughly accurate model you actually maintain beats a perfect system you abandon after two weeks. Your first version might just track deposits and major costs. That's fine. Add complexity as you get comfortable with the routine.
The compound benefits build over time. After six months, you'll have enough historical data to spot patterns. After a year, your projections become noticeably more accurate. After two years, you'll wonder how you ever managed without this visibility.
Running a catering business without a proper cashflow forecast is like driving at night without headlights—you might know the road, but you can't see what's coming until it's too late to react. The three-horizon model turns on those lights at exactly the distances you need: immediate hazards at 30 days, upcoming turns at 90 days, and the destination at 12 months. The events industry has enough unavoidable chaos—your cash position doesn't need to add to it.
Ready to elevate your catering business?
Join 500+ caterers trusting Caterngly to save time, reduce errors, and deliver flawless events.