


Most caterers know their overall margin. Ask them what they netted on last Saturday's 180-cover wedding versus the corporate lunch buffet they ran the same week, and the answers get fuzzy fast. The food cost they can pull. Everything else — venue travel, the admin hours spent chasing a client's seating chart, the truck that sat idle between drop-offs — gets swallowed into a monthly overhead number that never touches the individual event.
That's where money quietly leaks. A job that looks profitable at the plate level can lose money once you load in the real cost of getting there, staffing it, and cleaning up the paperwork afterward. And because the loss is buried, you keep booking more of the same event type, convinced it's a winner.
A per-event P&L fixes this, but only if the allocation rules are consistent. The whole point is that you stop guessing which categories of work actually make money. This piece lays out a canonical structure — what goes on the statement, how to split overhead you can't directly trace, what margin to expect by event type, and the thresholds that tell you to accept, reprice, or walk away.
Why per-event profitability breaks down in the first place
The root problem isn't math. It's that catering has three cost layers, and only one of them is easy to attribute.
Direct costs attach cleanly to a single event: food, disposables, the specific rental order, event-day labor hours. Nobody struggles here.
Semi-direct costs are traceable but usually ignored. The two hours a coordinator spent building a proposal and re-quoting after a scope change. The fuel and driver time for a 40-minute haul to a vineyard. The overtime that spilled over because two events overlapped. These belong to specific events, but they rarely get logged against them.
True overhead genuinely can't be traced to one job: your commissary lease, insurance, the owner's salary, software subscriptions, the base pay of salaried staff who work across everything. This has to be allocated using a rule, not measured.
What tends to happen across a lot of catering books is that the semi-direct layer gets treated like overhead — dumped into a monthly bucket — and the true overhead never gets pushed down to events at all. So the per-event number people think they're looking at is really just revenue minus food minus event-day wages. That's a gross contribution figure wearing a profit costume.
At low volume you can get away with it. When you're doing eight events a month, the owner has a gut feel for which ones were painful. At 30–40 events a month across three event types and two crews, that gut feel collapses. You need the allocation rules written down so every event gets scored the same way.
The canonical per-event P&L structure
Here's the skeleton every event statement should follow. The order matters, because it separates decisions you make during pricing from decisions you make about the whole business.
End chaos with centralized catering management.
Caterngly helps you plan, confirm, and manage every catering event seamlessly.
- Unified event and order management
- Real-time client updates
- Staff and resource scheduling
No credit card required
| Line | Category | Example items | How it's assigned |
|---|---|---|---|
| Revenue | Contracted total | Food, service, rentals rebilled, service charge | Direct |
| Less: Direct food & bev | COGS | Ingredients, beverage, disposables | Direct (from prep sheets) |
| Less: Event labor | Variable labor | Cooks, servers, captains, event-day OT | Direct (from schedule) |
| = Gross contribution | |||
| Less: Logistics allocation | Semi-direct | Fuel, driver hours, vehicle, load-in crew | Rule-based (see below) |
| Less: Venue/site allocation | Semi-direct | Site fees, permits, extra equipment for the space | Direct or rule-based |
| Less: Admin/sales allocation | Semi-direct | Proposal time, coordination, change orders | Rule-based per event-hour |
| = Event operating margin | |||
| Less: Overhead absorption | True overhead | Lease, insurance, salaried base, software | Allocated per event or per cover |
| = Net event profit |
The two bold lines in the middle — gross contribution and event operating margin — are the ones you use to make booking decisions. The final net event profit tells you whether your pricing is covering the whole business, which is a different question and one you revisit less often.
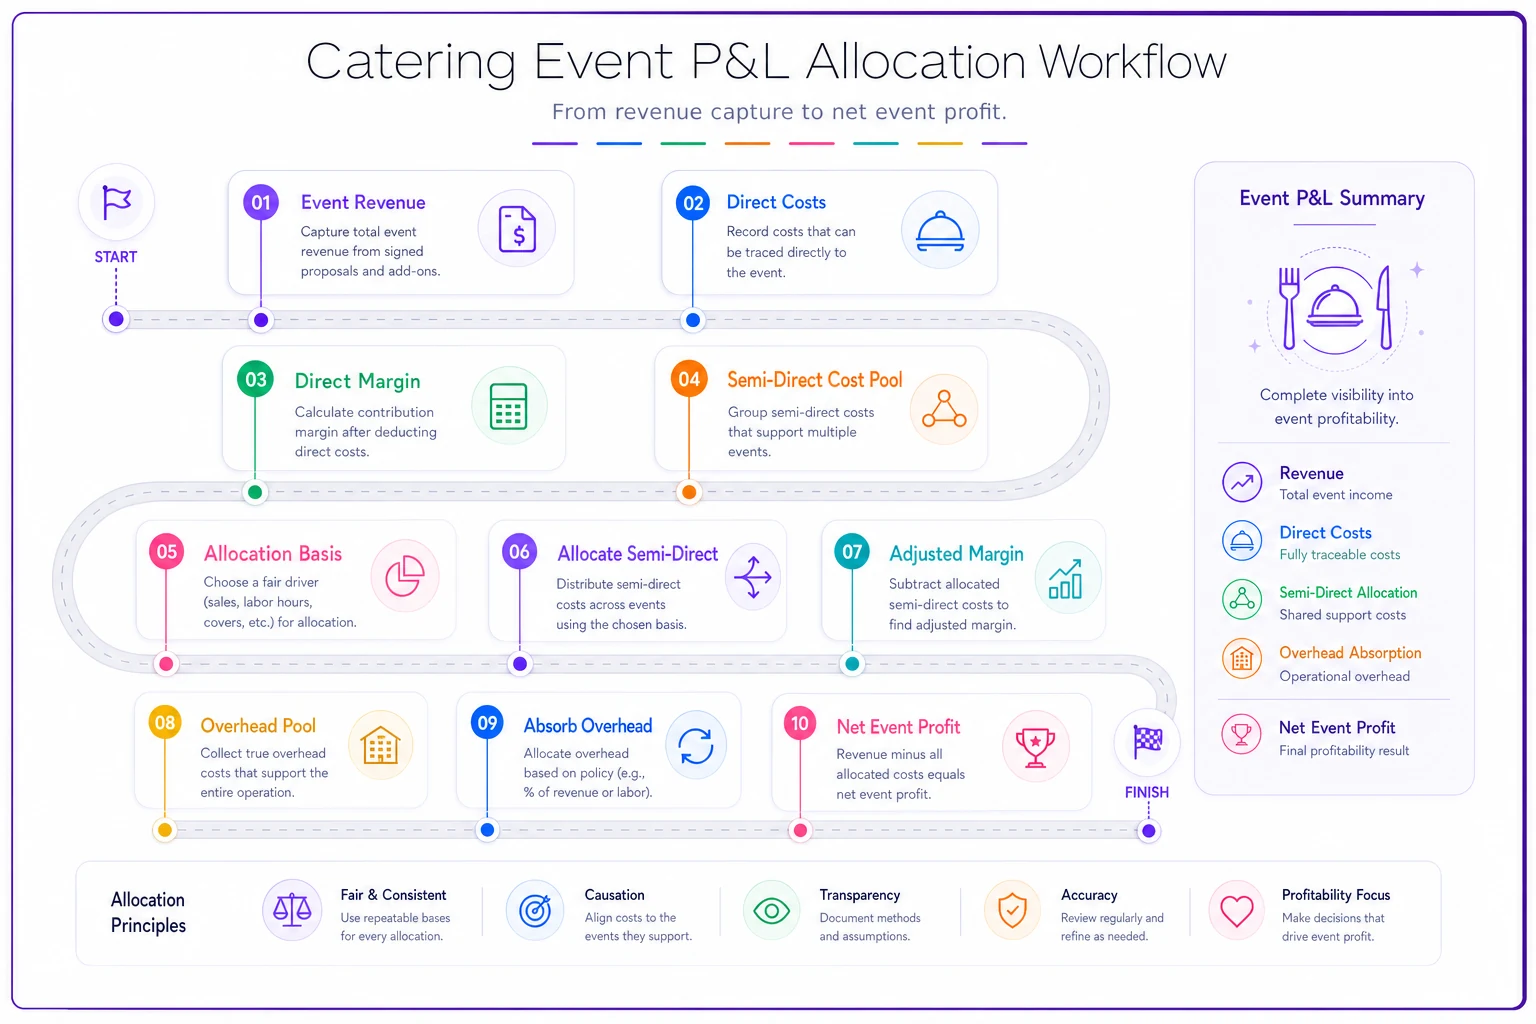
Keeping these separate stops a common mistake: rejecting a job because full overhead absorption pushed it slightly negative, when the operating margin was healthy and the event was actually helping cover fixed costs on a slow week.
Allocation rules that hold up: venue, logistics, admin
The credibility of the whole system rests on these three rules being consistent. Pick a method and apply it to every event, even when it feels approximate. A consistent approximate rule beats a precise one you only use sometimes.
Logistics allocation
Logistics cost scales with distance and load size, not with revenue. Allocating it as a flat percentage of the invoice is where most people go wrong — it punishes small nearby jobs and lets big far-away ones off easy.
-
Driver + vehicle time at a loaded hourly rate (wage + fuel + a per-mile vehicle allowance), multiplied by round-trip drive time.
-
Load-in/load-out crew hours at their wage.
-
A multi-stop divisor when a truck serves two events on one run — split the shared leg by number of stops, not evenly by revenue.
If your loaded logistics rate runs roughly $55–$70 an hour all-in, a 45-minute-each-way vineyard job with two loaders for an hour each carries somewhere around $150–$200 in logistics before anyone plates a thing. That number needs to be on the event, not buried in a monthly fuel line.
Split shared truck legs by stop count rather than revenue to fairly apportion logistics costs.
Venue/site allocation
Most site costs are direct — a venue fee you pay, a permit, extra warming equipment because the kitchen is 300 feet from the tent. Assign those straight to the event.
The rule-based piece is the hidden site cost: venues that force longer setups, tight elevator access, union requirements, or mandatory breakdown windows that generate overtime. Tag these venues in your records. Once you've worked a difficult site twice, you'll have a realistic setup-hour multiplier. Some downtown hotels reliably add 30–40% to load time versus a ground-floor event space. Bake that into the labor estimate for that venue rather than eating it as a surprise every time.
Admin and sales allocation
This is the layer nobody wants to count, and it's often the difference between a job that clears 20% and one that clears 12%. The cleanest method: track total monthly admin and sales labor hours — proposals, coordination, client calls, change orders, post-event reconciliation — and divide by the number of events. That gives a baseline admin cost per event.
Then adjust for complexity. A repeat corporate drop-off might consume a third of the average admin time. A first-time wedding with a demanding planner might consume triple. A simple three-tier multiplier — light, standard, heavy — is enough. If your baseline admin load runs around $250 per event, a heavy job might carry $600–$750, and that's real money you were previously just giving away.
Post-event work is part of this too. If matching deliveries and invoices to the event ledger routinely burns an hour per job, that hour belongs in admin allocation. The mechanics of doing that cleanly are worth a read in post-event reconciliation for caterers.
Margin bands by event type
Different event types have structurally different economics, so holding them all to one target margin is a mistake. Weddings carry heavy admin and setup but command premium pricing. Corporate drop-offs are thin per cover but nearly free on coordination. Here's the pattern that shows up once caterers actually separate them:
| Event type | Typical gross contribution | Healthy operating margin | Where the pressure is |
|---|---|---|---|
| Full-service wedding | 55–65% | 18–28% | Admin, setup labor, overtime risk |
| Corporate plated / gala | 50–60% | 15–22% | Labor timing, venue rules |
| Corporate drop-off / buffet | 45–55% | 12–18% | Thin ticket, logistics on small orders |
| Social (private parties) | 50–60% | 14–20% | Scope creep, last-minute changes |
| High-volume / concessions | 35–45% | 8–14% | Volume-dependent, waste sensitivity |
These are bands, not promises — your commissary cost and market set the real numbers. The value is in comparing your events against your bands. When a wedding lands at 12% operating margin against an 18–28% band, that's a signal to inspect it, not a disaster on its own. Usually it's overtime or a scope change nobody repriced.
Building these bands is much easier when your KPIs are already flowing per event. If you haven't set that foundation yet, the approach in why a catering KPIs dashboard reveals per-event profit leaks pairs directly with this — the dashboard feeds the P&L, and the P&L gives the dashboard something worth measuring.
Decision thresholds: accept, reprice, or walk
Once you can compute operating margin at quote time, you can set rules instead of negotiating with your own optimism. A simple three-threshold system works for most operations:
-
Green — accept as quoted. Operating margin lands inside or above the band for that event type. Book it, no special handling.
-
Yellow — accept with conditions. Margin is 3–6 points below band. You accept only if you can attach a reason: it fills a dead date, it's a strategic client, or a small price or scope adjustment pulls it into band. Document which lever you pulled.
-
Red — reprice or decline. Margin is more than 6 points below band, or gross contribution falls below your break-even absorption line. Requote. If the client won't move, walk.
Two nuances worth keeping in mind. First, on genuinely slow weeks, a Yellow job that clears its operating margin — even if it doesn't fully absorb overhead — is often worth taking, because your fixed costs run whether the truck moves or not. Second, a Green job at a nightmare venue can still be a Red decision once you apply the venue setup multiplier honestly. The threshold reads the number after allocation, which is the whole point.
Where this connects to the broader money picture is cash timing. A job can be margin-healthy and still strain you if the deposit schedule leaves you funding food and labor weeks ahead of final payment. Reading acceptance decisions alongside a three-horizon cashflow model keeps you from booking a profitable event that quietly creates a cash hole.
A worked example
Take a Saturday wedding, 140 covers, plated service, at a vineyard 40 minutes out.
-
Revenue $18,900 (food, service, rebilled rentals, service charge)
-
Direct food & bev $6,600 (about 35% of revenue)
-
Event labor $4,400 (cooks, 12 servers, two captains, one hour of unplanned OT at breakdown)
-
Gross contribution $7,900 → 42%
So far it looks a little light for a wedding, but not alarming. Now apply allocations.
-
Logistics two trucks, loaded driver/vehicle time plus two loaders each end → about $310
-
Venue/site vineyard adds a 30% setup multiplier and generator rental → about $520
-
Admin/sales first-time client, two rounds of proposal revisions, one change order → heavy tier, about $680
-
Event operating margin $7,900 − $1,510 = $6,390 → 34%
Against an 18–28% band, this is Green — genuinely strong. But notice the shape of the number. Nearly half the costs above food-and-labor came from admin, not logistics or venue. If this client type keeps demanding three proposal rounds, admin allocation on similar jobs will climb and pull future weddings toward Yellow. That's exactly the kind of pattern a per-event P&L surfaces that a monthly summary buries completely.
Finally, apply overhead absorption. Say your monthly overhead spread across roughly 34 events runs about $520 per event. Net event profit lands near $5,870 — around 31% — a clean job. The reason to keep operating margin and net separate is now obvious: the booking decision was already clearly Green at the operating line, before overhead entered the conversation.
Rolling this out without drowning in spreadsheets
The honest obstacle isn't the model — it's data collection. A per-event P&L is only as good as the hours and costs that get logged against the right event. Where this falls apart in practice:
-
Event-day labor isn't tracked to the event, so it gets averaged.
-
Change orders happen verbally and never hit the admin log.
-
Logistics gets recorded as a single monthly fuel bill.
-
Post-event reconciliation slips, so final actuals never replace the estimates.
A short checklist to get a working version live within a month or two:
-
Define your event types and set a target margin band for each based on your last 20–30 jobs.
-
Write the three allocation rules — logistics rate, venue multipliers, admin baseline — and don't change them mid-quarter.
-
Log event labor to the event, including OT, from the schedule.
-
Capture change orders in writing and attach their admin cost.
-
Replace estimates with actuals after each event so the P&L reflects reality, not the quote.
-
Review the band vs. actual gap weekly, not monthly — deviations are cheaper to fix while the event is fresh.
Much of this can ride on top of systems you may already run. When bookings, POS, and payroll feed into one place, event-level costs assemble themselves instead of being reconstructed by hand — which is exactly the failure the per-event view is meant to eliminate. And once allocation is consistent, the same numbers feed straight into pricing, keeping your cost cards and price triggers honest. That connection between costing and pricing is worked through in designing a KPI-linked pricing system.
Who this actually helps — and who can skip it
If you're running fewer than a handful of events a month, a full per-event P&L is more discipline than you need right now. A solid contribution calculation plus a rough overhead check will do. The payoff arrives when you're juggling multiple event types, overlapping schedules, and enough volume that your intuition can't hold every job in its head.
It also matters most when your mix is shifting. Caterers who add a new service line — say, moving from weddings into corporate drop-offs — often assume the new work is profitable because the top line grows. Without per-event costing, they don't notice that thin-margin drop-offs are consuming logistics and admin capacity that used to serve higher-margin events. Revenue looks up while the net quietly softens.
The system isn't about producing a perfect number for every event. It's about applying the same rules to every event so the comparisons are fair. That's what turns a pile of bookings into a readable picture: which event types earn, which venues cost you, which clients deserve a repricing conversation, and which jobs you should be politely declining. Once the allocation rules are fixed and the data flows, the P&L stops being an accounting chore and becomes the thing you check before you say yes.
Ready to elevate your catering business?
Join 500+ caterers trusting Caterngly to save time, reduce errors, and deliver flawless events.